Tripo P2 vs H3.1: The 20K Face Limit Test
Same-image Tripo P2 vs H3.1 test with actual charges, GLB sizes and a measured 794-triangle overrun on one P2 output.
Tripo P2 returned 20,794 triangles for the dog-and-bench image after receiving a face limit of 20,000. Tripo H3.1 returned 18,834 for the same image and requested limit. Both reconstructed the bench’s seat, legs and open backrest. The two models also produced visibly different shapes in the dog’s tail and in the rolled material on a second input. The price difference matters, but a team with a hard triangle budget has to inspect the file before treating either result as deliverable.
Key takeaway
- Four requests on November 14, 2026 compared Tripo P2 and H3.1 on the same two images. Both routes received a 20,000 face limit, triangle topology and standard PBR texturing.
- The actual charges were $1.32 per P2 run and $0.36 per H3.1 run. Both delivered GLB files with base-color, metallic-roughness and normal textures.
- The P2 bench output exceeded the requested face limit by 794 triangles. The other three results were below 20,000.
- Both bench results retained the major visible parts. The test does not establish the accuracy of the inferred rear surfaces, which had no reference photos.
Set a shared target and then measure the file
The first input shows a brown satchel with a shoulder strap, a pair of front buckles and a roll held across the top. The second shows a dog sitting on a metal bench. The bench is a harder visual test because the asset needs to preserve several thin legs, an open backrest, arms and a partly occluded seat. Both inputs are public SandBase examples. The two Tripo routes received the same image per pair, with a single run on each configuration. Tripo P2 parameters · Tripo H3.1 parameters
| Setting or result | P2 | H3.1 |
|---|---|---|
| Input | Same single image per pair | Same single image per pair |
| Requested face limit | 20,000 | 20,000 |
| Quad option | false | false |
| Texture | true | true |
| PBR | true | true |
| Texture quality | standard | standard |
| Seed argument | 42 | 42 |
| GLB exports in this test | 2 | 2 |
| Actual charge per run | $1.32 | $0.36 |
The matching settings make the comparison easier to read. They do not synchronize the models’ internal sampling. H3.1 also exposes a geometry quality option, which remained at the route default. The goal was to compare the files delivered at shared options, not to exercise every quality tier. The observed face counts were calculated from the exported GLB accessors. The input limit is a useful control, and the file is the evidence for acceptance.
Satchel: look into the roll and around the strap
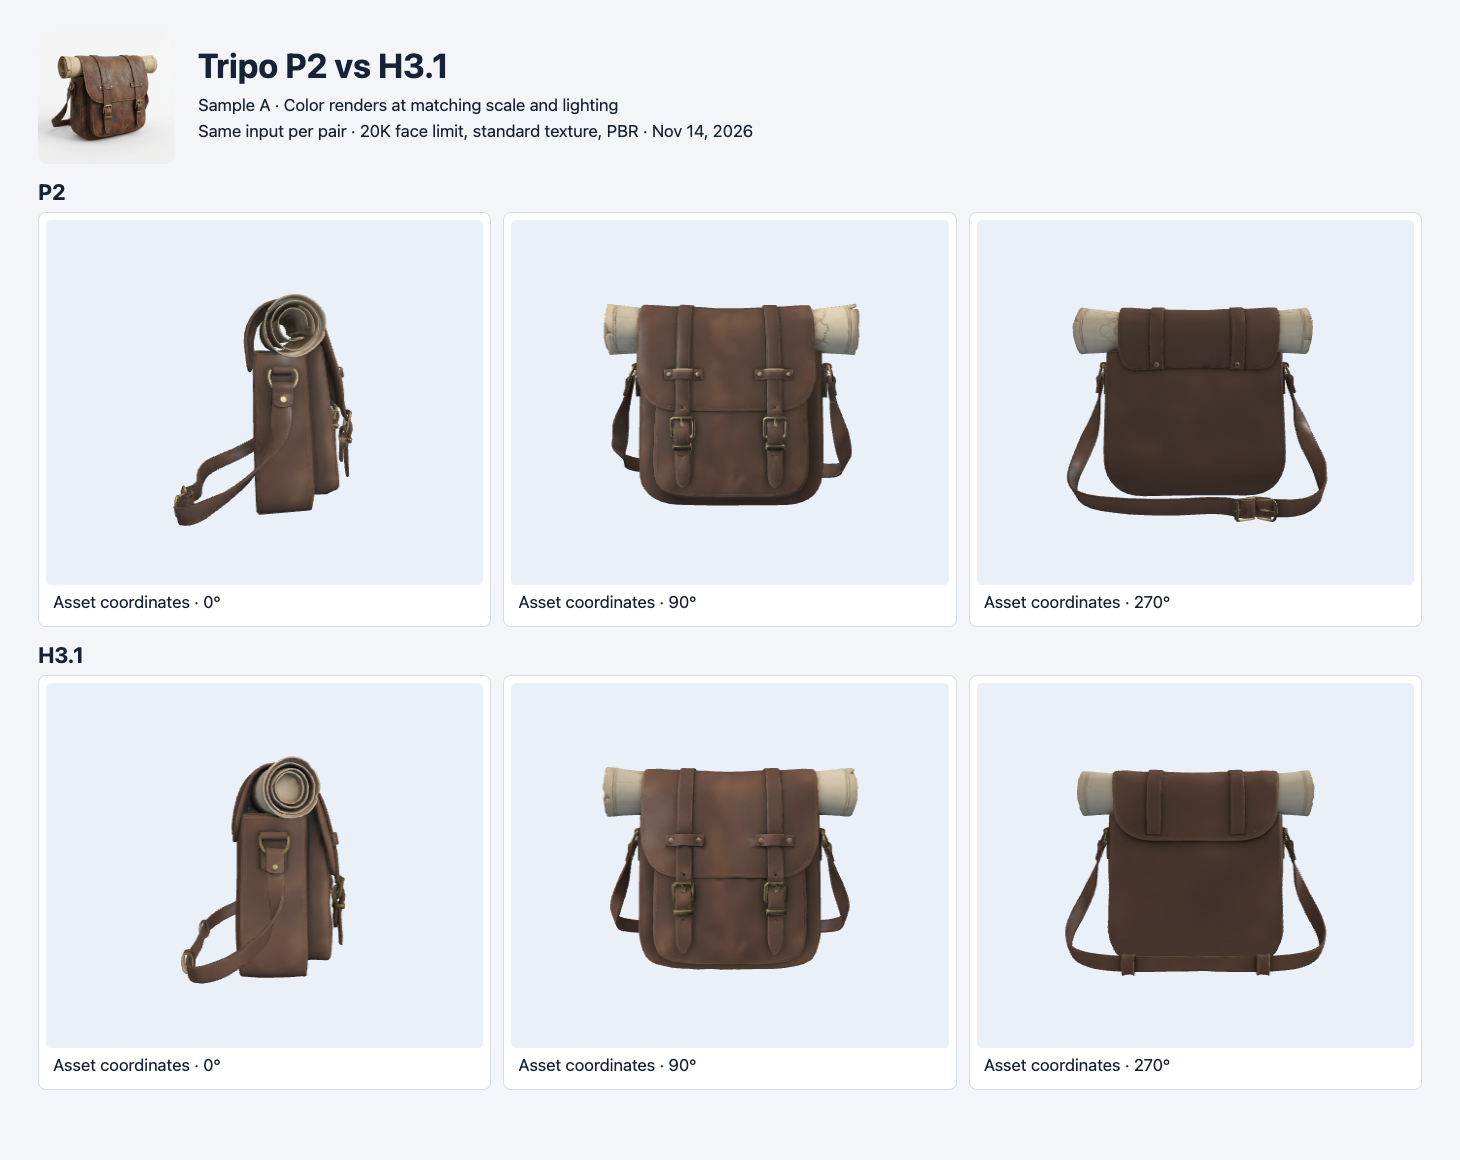
Both results used the input in the header. The columns show side, front and rear under fixed camera positions, labelled in the exported asset coordinates.
At the front, both models retain the outline, straps and two buckles. The side view reveals a different interpretation of the roll. P2 shows a dark, deeper opening, while H3.1 shows a flatter circular center with concentric rings. The shoulder straps extend past the bag on both meshes. The sample demonstrates that the two routes can agree on the recognizable parts and disagree on how far a recess extends. A second reference photo facing the roll would be needed to grade the hidden geometry.
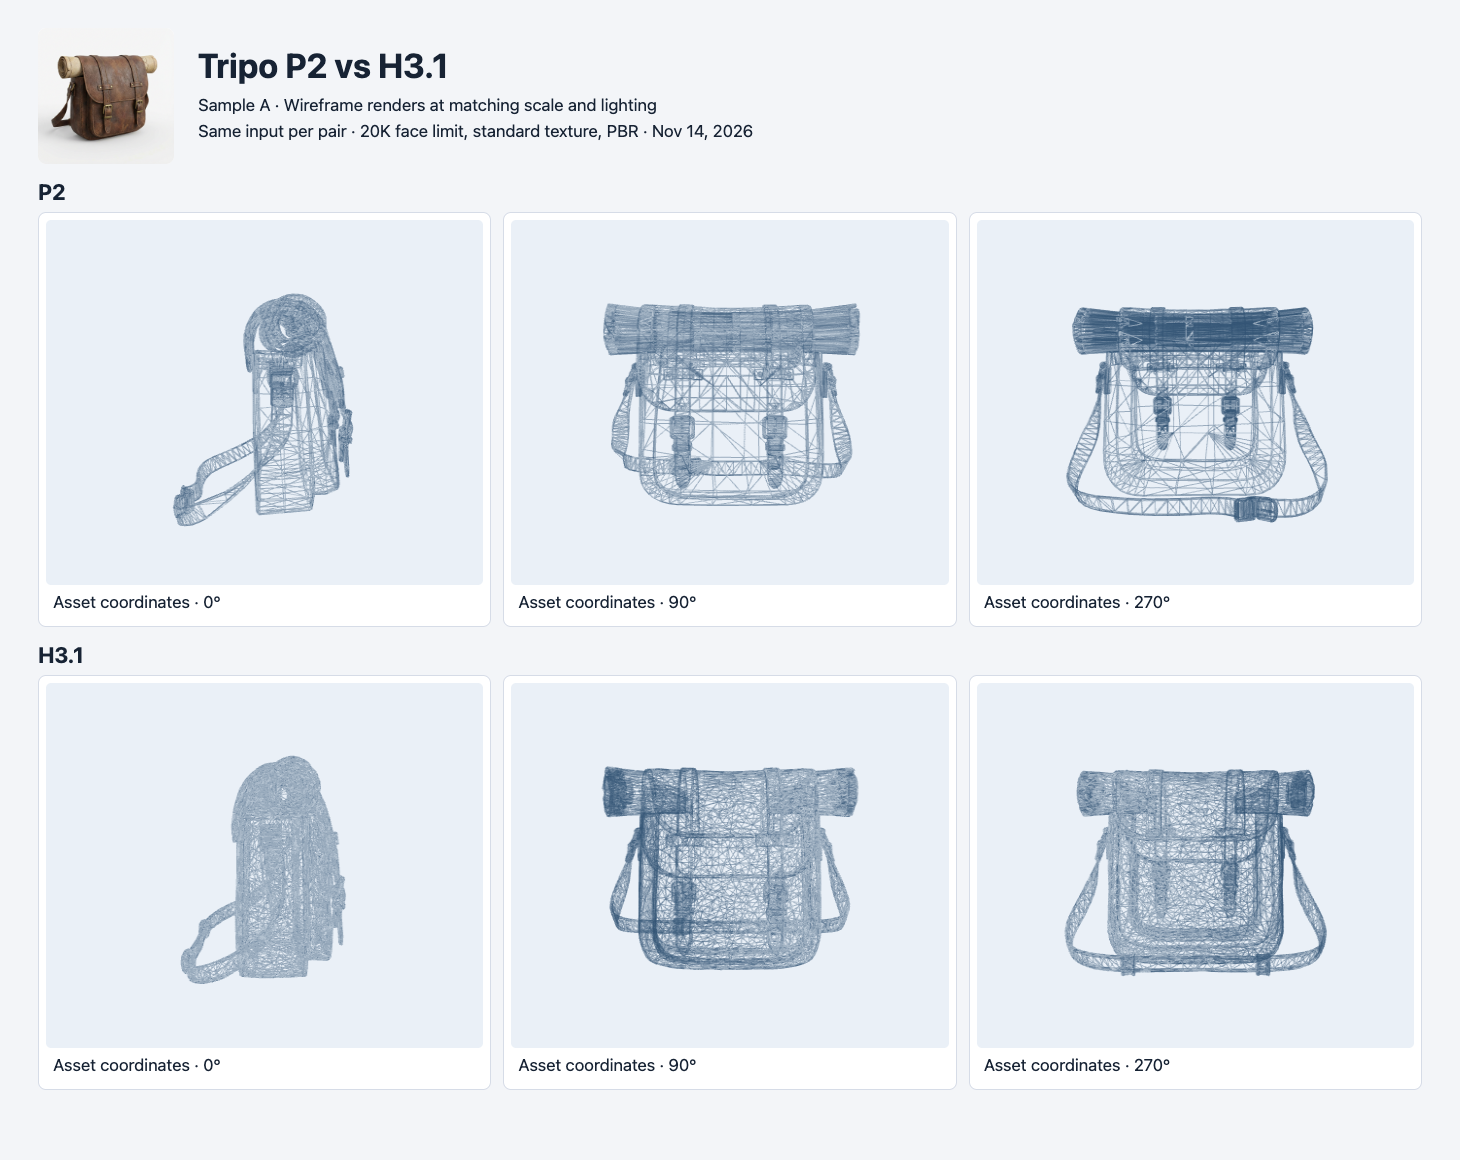
The original material is replaced by a wireframe for inspection. Both models are scaled to the same longest bounding-box side.
The satchel meshes both fit the 20,000-triangle budget. P2 has 19,796 triangles, while H3.1 has 19,293. The difference is 503. The P2 file is also 253,280 bytes larger for this asset. Those figures let a developer test the trade-off on a device with a known memory or network budget. The wireframe helps find where a particular part is modeled. It cannot by itself show whether the surface looks right when textured or whether the hidden parts are correct.
Dog and bench: retain the structure and count again
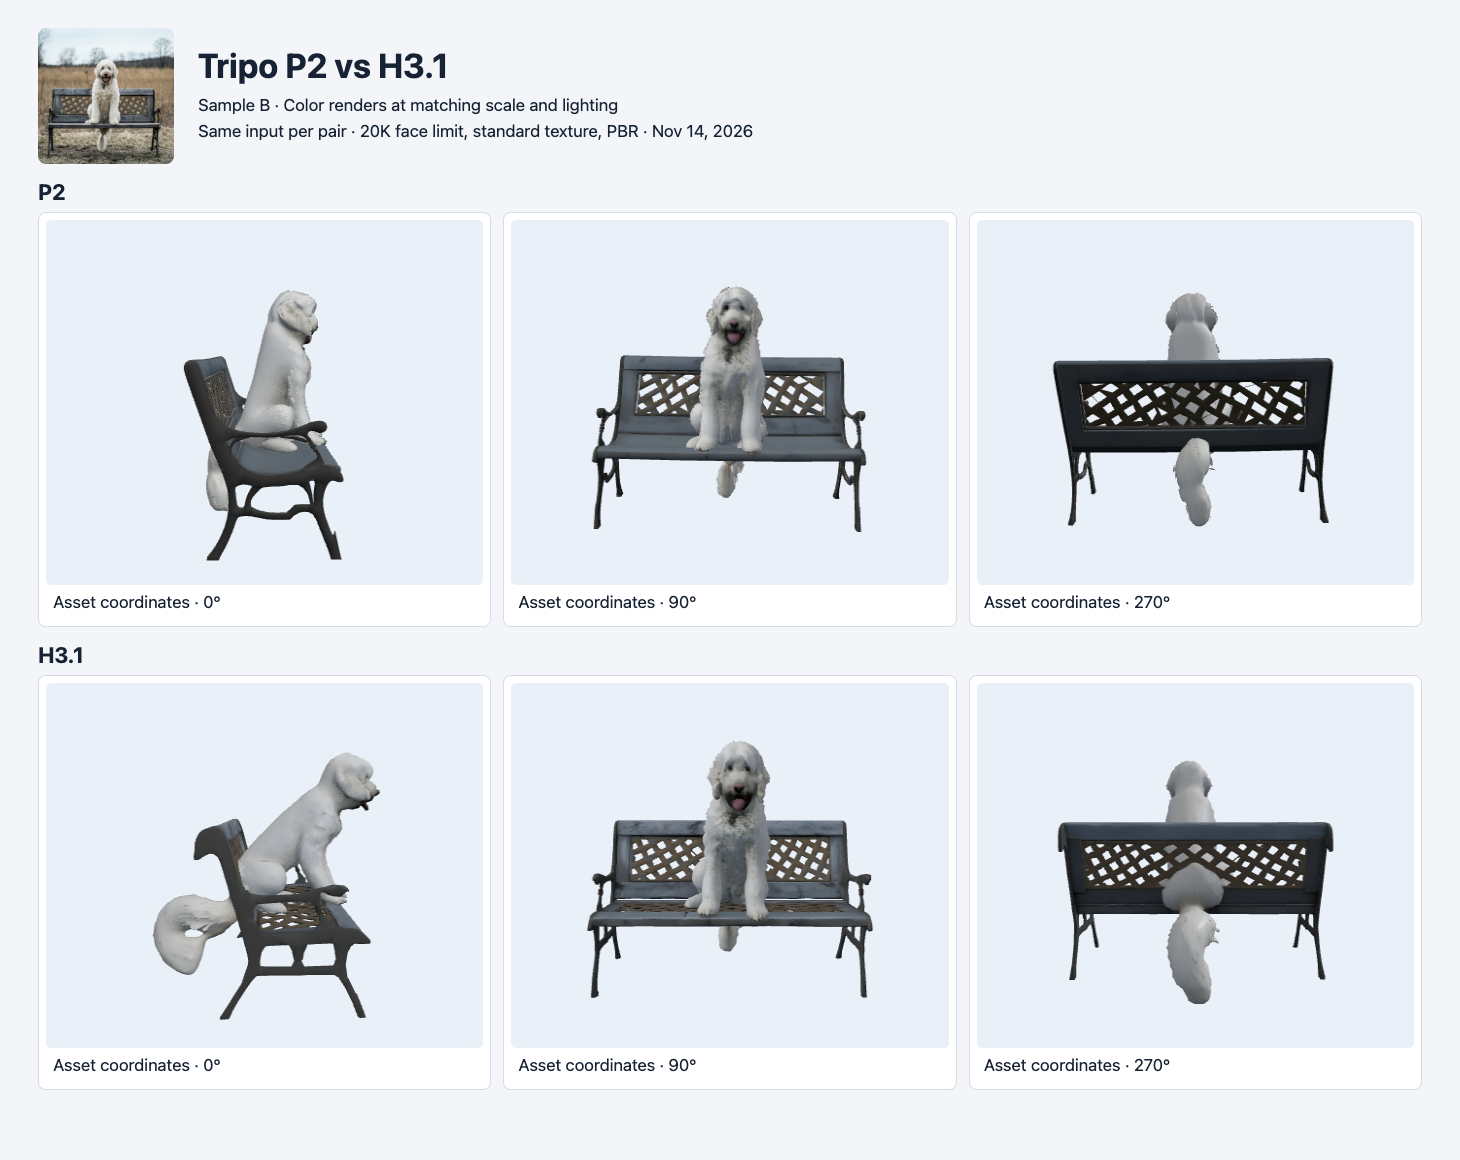
Both runs keep the major structure of the bench. The rear view shows different interpretations of the dog’s tail and the surfaces behind the backrest.
On this input, both versions kept the visible parts needed for a recognizable bench, including thin legs and openings in the backrest. H3.1 shows a larger loop-shaped form extending behind the seat in the side view. P2’s tail form hangs down more narrowly. The front photo does not establish how that shape should look behind the bench. If the task requires the entire visible scene, both have a stronger starting point than an output that contains only the dog. If the task requires a faithful rear view, both need another reference.
P2 exceeded the requested 20,000 by 794 triangles, or 3.97%. H3.1 stayed below it at 18,834. This is one observed result, so do not estimate the frequency of overruns from it. For a hard asset budget, count triangles after download, reject or simplify the file if necessary, and validate the final export again. A geometry budget can be enforced by the application even when a generation route does not return the exact number requested.
For an engine with a hard triangle limit, reserve enough space for any geometry that is added during import. A GLB can use several primitives or scene nodes, so decide whether the check counts mesh definitions or every visible instance. Here each asset had one mesh and one triangle primitive, making that distinction immaterial to the reported counts. On a larger scene, use the same accounting rule for each candidate and document it before setting a threshold.
Read the GLB and the validator separately
| Sample | Route | Bytes | Triangles | Embedded images | Validator errors / warnings |
|---|---|---|---|---|---|
| Satchel | P2 | 3,406,460 | 19,796 | 3 | 0 / 1 |
| Satchel | H3.1 | 3,153,180 | 19,293 | 3 | 0 / 1 |
| Dog and bench | P2 | 3,879,772 | 20,794 | 3 | 0 / 1 |
| Dog and bench | H3.1 | 4,447,736 | 18,834 | 3 | 0 / 1 |
All four rendered in the same Three.js loader, under the same lights and background. Each GLB embeds a base-color image, a metallic-roughness image and a normal image. The validator reported one generated tangent-space warning per file. Normal mapping can depend on how the renderer constructs tangent space, so use your target engine when assessing fine material detail. A warning is useful context for that check. It does not make the file unreadable in the browser used here. Khronos glTF Validator
The larger triangle count did not always imply the larger file. On the bench P2 had more triangles but was about 568 KB smaller. Embedded images and vertex attributes also take space. Track the exact bytes you will serve and the exact geometry you will render. If you change texture compression or run a mesh simplifier, repeat both measurements on the final asset.
Reproduce the comparison
The command below submits P2 on the satchel. Use tripo3d/tripo-h3.1/image-to-3d for H3.1. Each submission starts a billable task. Keep the API key in a server-side environment variable. Poll the returned ID with GET /v1/run/{id} and download the completed GLB. Keep the provider output and validation report together.
jq -n --arg image 'https://static.sandbase.ai/examples/trellis/trellis-2/input_image_0.png' \
  '{model:"tripo3d/tripo-p2/image-to-3d",image:$image,seed:42,
    face_limit:20000,quad:false,texture:true,pbr:true,texture_quality:"standard"}' |
curl --fail-with-body -sS https://api.sandbase.ai/v1/run \
  -H "Authorization: Bearer $SANDBASE_API_KEY" \
  -H 'Content-Type: application/json' --data-binary @-
For the bench pair, use https://static.sandbase.ai/examples/pixal3d/pixal3d/input_image_0.png as the image URL and leave the settings alone. The test records did not establish comparable completion times. For latency, record both submission and terminal confirmation for multiple runs, using the same polling interval. That will capture user-visible waiting time with a known observation cadence.
Choose by the check that matters
For a pipeline that wants a low-cost first draft and a fixed triangle cap, start by testing H3.1 with a local post-download check. Both H3.1 files stayed below the target here, and both preserved the main visible parts. For a surface or thin structure that fails acceptance, run P2 on the same input and inspect that exact feature. On the satchel, the roll was a useful comparison target because it looks similar at the front but different in profile. If the shape still matters after generation, verify it against a new photo.
At the charges observed here, 100 completed requests would cost $36 on H3.1 or $132 on P2 with unchanged settings and prices. The $96 difference is a generation-only comparison. A better deployment measure includes the cost of jobs that fail visual or geometry acceptance, plus the time spent fixing them. A team can record the number of assets below the limit, the number that survive visual review, and the number that pass both. A pair of good-looking screenshots is not enough to estimate that rate.
For a second matched-budget experiment, see Rodin 2.5 Fast vs Standard. It used the same two input photos and a 20K setting. Both Rodin results omitted much of the bench, which makes a useful comparison when visible structures are the actual requirement.
Found this useful? Share it