Meshy 7.1 vs T2.5 for Low-Poly Game Props
Four exports of the same field-tool prop compare actual triangle counts, open edges, silhouettes, file sizes and 64 px previews.
We asked Meshy 7.1 and T2.5 to generate a game prop from the same image. An 8,000-triangle request produced 7,119 triangles from 7.1 and 8,160 from T2.5. Both looked like the same blue signal tool at inventory-icon size. On the long side of the case, the two models spent their triangles differently. The extra 160 triangles also make the T2.5 result unsuitable for a build that rejects every asset above 8,000.
Key takeaway
- Both 8K exports kept open space under the carry bar and both colored lenses remained distinguishable in the rendered 64 px tiles. The hidden rear louver and plug were missing from all four generated models.
- T2.5 concentrated visible edges around the casing borders and lenses and had a higher median triangle shape score in both pairs. The same test also found 185 and 258 one-face edges in the T2.5 exports.
- At 8K, 7.1’s front and side silhouettes overlapped the authored reference more closely. T2.5 used 68,944 fewer file bytes. Its JPEG was smaller, while the remaining package payload was slightly larger.
- Check the exported triangle count, outside silhouette and opening clearance before accepting either route. Check the mesh edge counts if downstream edits require a closed surface.
Run the same prop at default and 8K targets
We reused the authored field tool from the Tripo H3.1 static-prop study. The 768 × 768 input shows a blue square housing, a large amber lens, a smaller lime lens, a red switch and a cream grip below the base plate. Two supports hold a raised carry bar. The authoring model has a rear louver and a round plug. These sit outside the single input view and give us a reference for what the generator invents on the far side.
We submitted the exact same PNG once per cell. Both routes generated base-color textures with PBR disabled and default pose, rigging and animation settings. The 8K requests added only target_polycount: 8000. The two default cells left the field unset. The schema for Meshy 7.1 Image to 3D lists a 30,000 default. Meshy T2.5 Image to 3D lists 15,000. Read the upper rows as practical defaults and use the lower pair when comparing at the same requested budget.
| Route | Triangles requested | Exported triangles | Original GLB bytes | Embedded JPEG bytes | Settled charge |
|---|---|---|---|---|---|
| Meshy 7.1 default | Omitted (30,000 schema default) | 27,876 | 3,618,616 | 2,418,428 | $1.44 |
| Meshy T2.5 default | Omitted (15,000 schema default) | 15,541 | 2,849,380 | 2,262,425 | $0.60 |
| Meshy 7.1 8K | 8,000 | 7,119 | 2,462,860 | 2,126,106 | $1.44 |
| Meshy T2.5 8K | 8,000 | 8,160 | 2,393,916 | 2,052,999 | $0.60 |
Four completed generations cost $4.08. We used the provider GLBs directly and measured the exported triangle primitives. All contained one 2,048 × 2,048 JPEG. The Khronos glTF validator returned zero errors and warnings for each file. Its result checks file validity. Our geometric incidence count below checks a separate property of the surface.
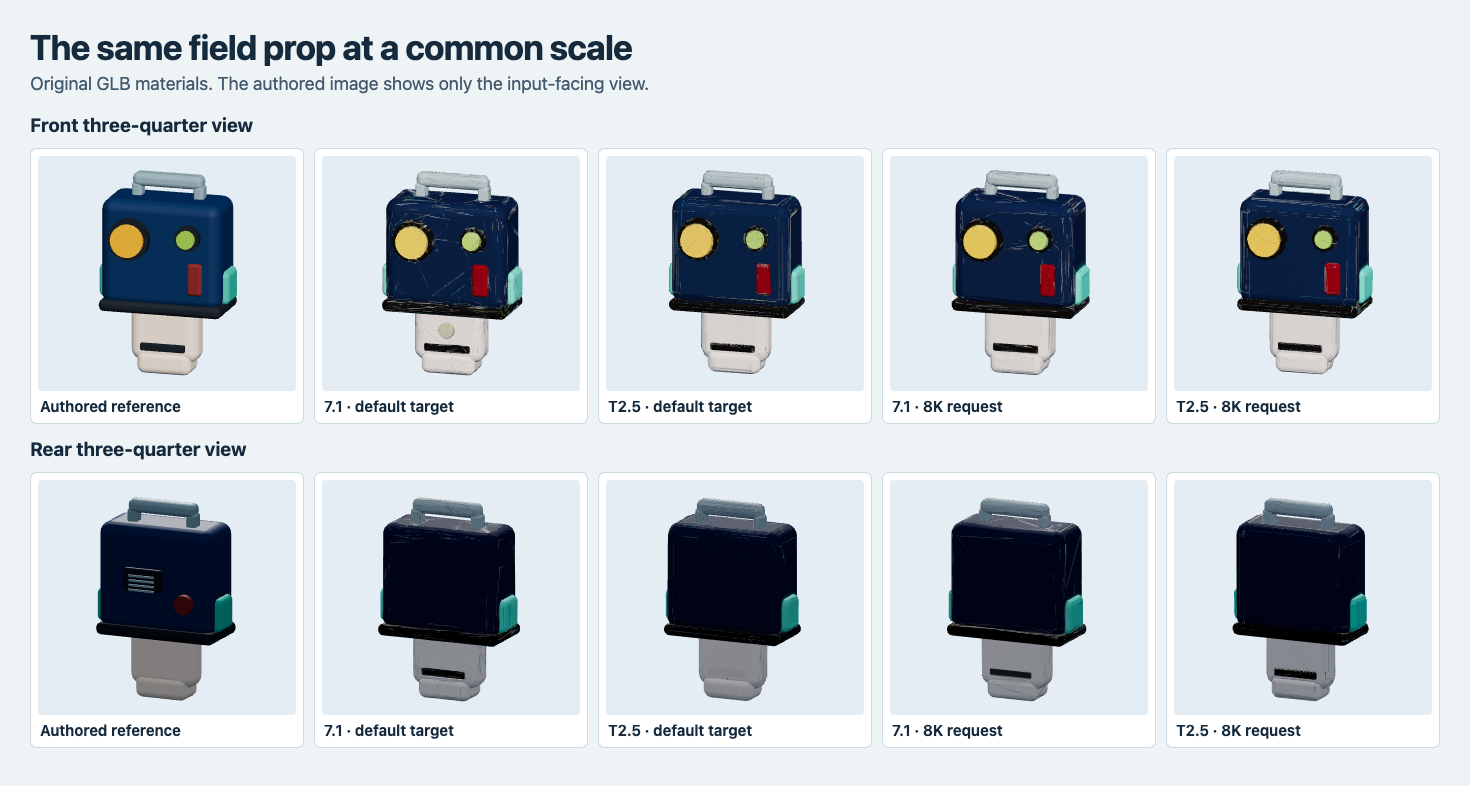
All four front renders show the blue case, two lenses, switch and cream grip. The rear view shows where the generated models omit the authored vents and plug.
Compare the physical shape at delivery scale
We centered each bounding box and divided all dimensions by its longest side. We looked at yaw candidates in 45-degree increments with the larger lens as the front anchor. All four exports lined up with the authored front at their original yaw. After alignment we used a 120 × 120 orthographic ray grid per view; the front and right-side planes used the same sampling span. For each view, silhouette intersection over union divides the shared hit rays by the rays that hit either asset. Depth error averages the absolute first-hit difference only over shared rays.
| Route | Front silhouette IoU | Side silhouette IoU | Front depth MAE, as share of longest extent | Open rays in front handle window |
|---|---|---|---|---|
| Meshy 7.1 default | 95.65% | 88.07% | 0.90% | 275/275 |
| Meshy T2.5 default | 98.45% | 84.16% | 2.24% | 275/275 |
| Meshy 7.1 8K | 99.21% | 86.15% | 1.53% | 275/275 |
| Meshy T2.5 8K | 97.99% | 83.79% | 2.54% | 275/275 |
The handle sample sends 275 straight front rays through a central window inside the gap on the authored part. Every generated asset left that window open. The test covers those sample points. The neutral side renders show other features the front projection hides, including the protrusion of the lenses and the absence of the reference’s raised rear components.
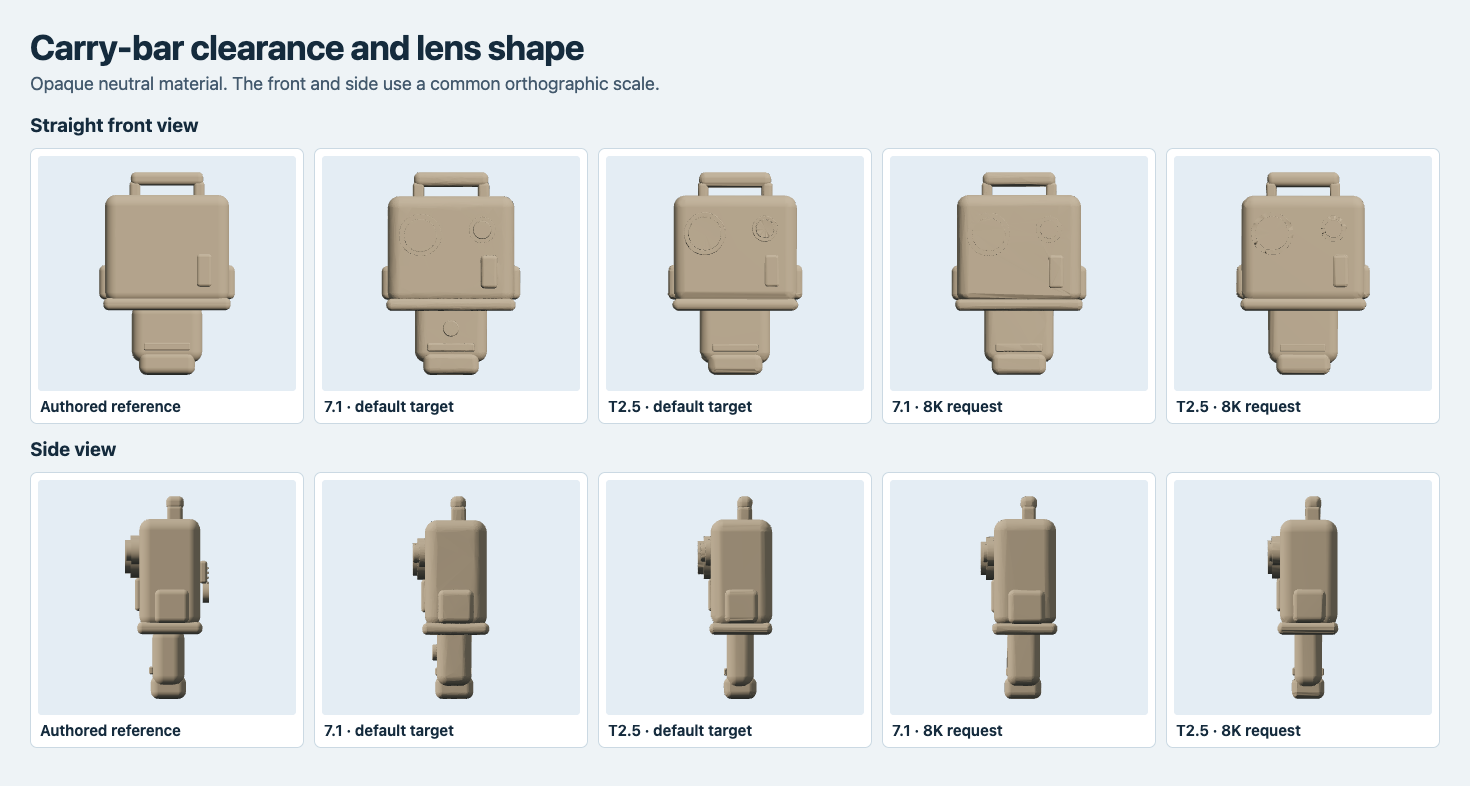
The straight front exposes the physical gap under the bar. The neutral side view reveals changes in the overall case depth and lens protrusion.
A higher silhouette score can accompany a larger front-depth difference. T2.5 at its default lined up better with the reference contour from straight ahead than 7.1 at its default. Along shared rays, its mean depth error was 2.24% of the longest side, compared with 0.90%. If a prop must line up with a holster, holder or character hand, use measurements on the corresponding side and across the contact surface.
Read edge placement and surface connectivity separately
The wireframes show T2.5 spending more of the visible front edges near the rounded borders and lens rings. 7.1 uses more diagonals across the large flat panel in these runs. To quantify one part of that difference, we measured a triangle’s shape as 4 × √3 × area, divided by the sum of its three squared edge lengths. An equilateral triangle scores 1; narrow slivers approach zero.
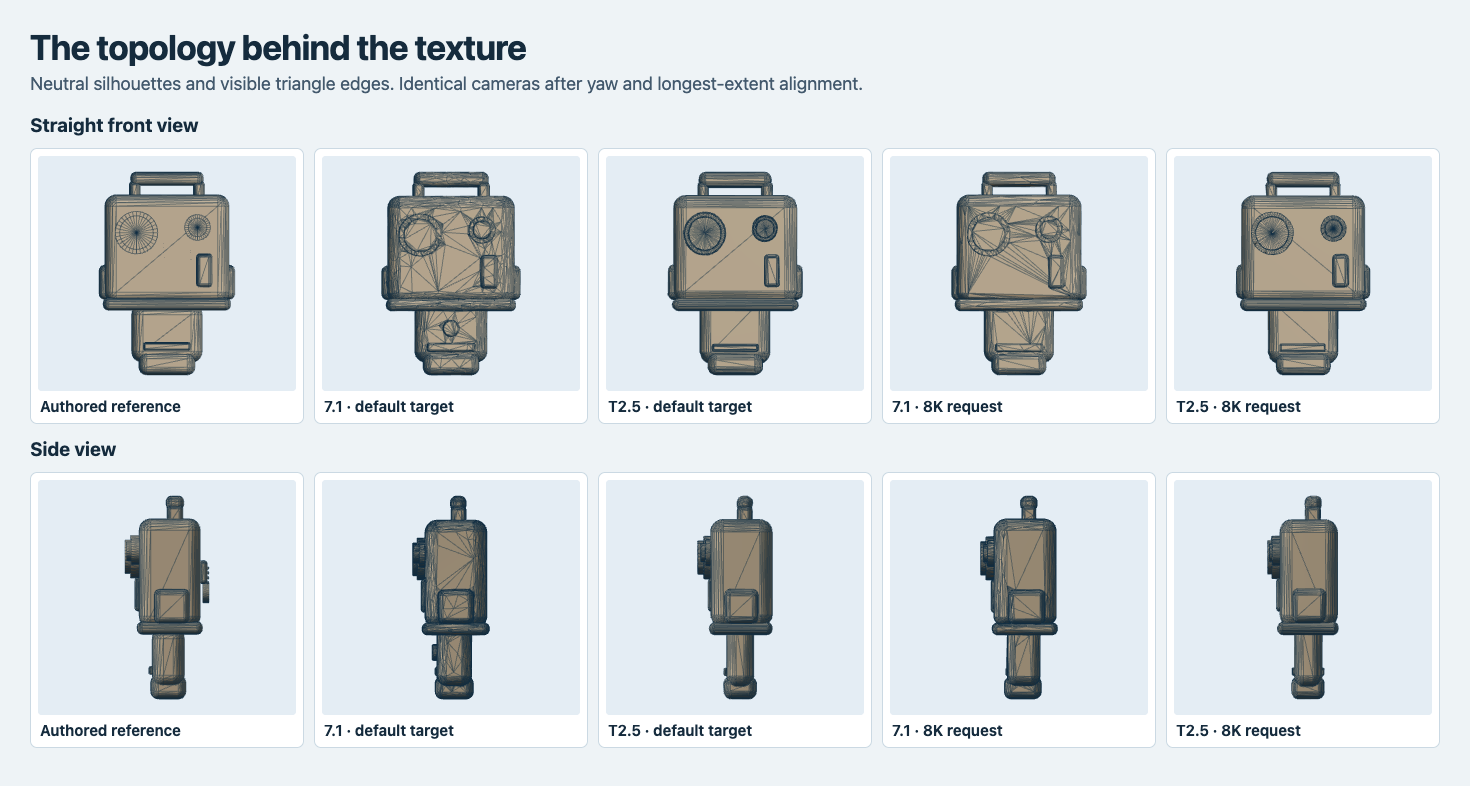
The straight-front crop shows large triangles over the flat panel and tighter triangles near curves. All lines are drawn from the exported triangles.
| Route | Median triangle shape score | Triangles below 0.25 | Edges with one face | Edges with more than two faces |
|---|---|---|---|---|
| Meshy 7.1 default | 0.474 | 27.04% | 159 | 66 |
| Meshy T2.5 default | 0.700 | 24.40% | 185 | 0 |
| Meshy 7.1 8K | 0.580 | 29.58% | 34 | 14 |
| Meshy T2.5 8K | 0.741 | 24.15% | 258 | 0 |
We grouped vertex positions on a rounded grid with a step of one millionth of normalized length to collapse coincident positions split across UV or normal seams. Then we counted faces per undirected edge. Testing steps ten and one hundred times larger gave the same edge counts on all four exports. One-face edges flag openings or disconnected borders in that positional analysis. Edges with three or more adjacent faces flag junctions that may complicate mesh operations. A static prop can render successfully with these counts. If the next step uses booleans or remeshing, inspect the affected areas on the actual exported asset.
Check the smallest useful view and the largest file budget
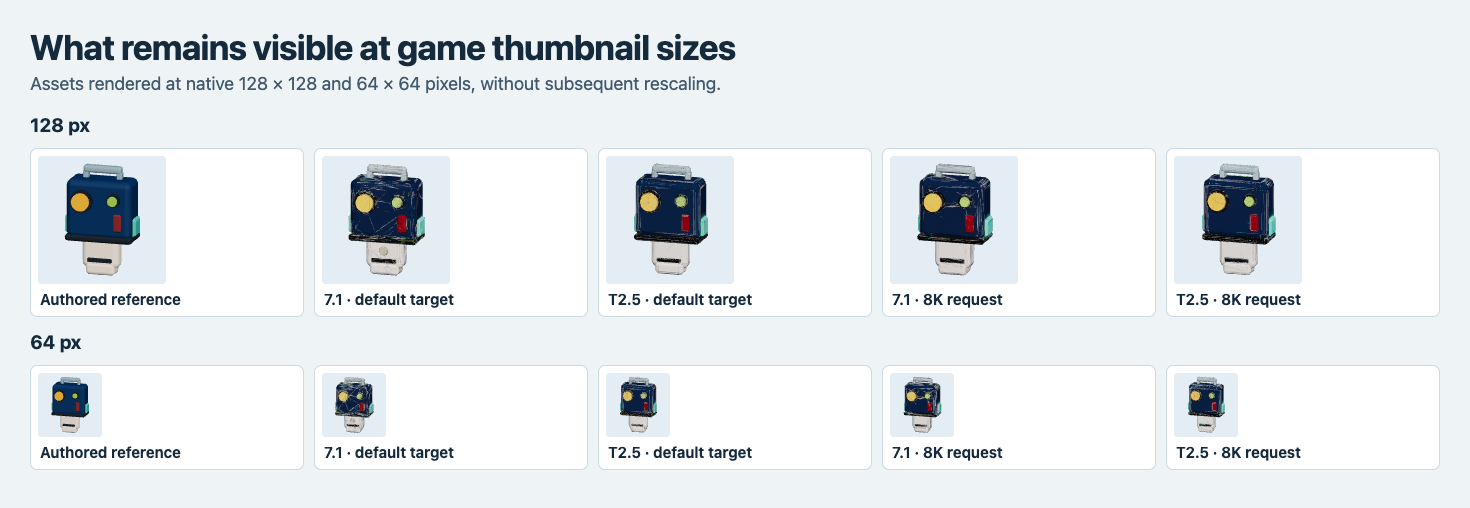
The original screenshot contains both native tile sizes. Color separates the round sensors from the navy face even in the 64 px row.
All four sets of lenses read as two dots at 64 px. The cream grip and blue housing also remain easy to distinguish. Brighter marks on the dark case are easier to see at 128 px and in the large color comparison, particularly on the 7.1 default sample. Inspect the texture and geometry separately before committing a close-up shot. The 64 px test represents a fixed browser thumbnail; the results apply to these assets, this light and this camera.
Moving from default to 8K dropped the 7.1 triangle count by 74.46% and its GLB size by 31.94%. For T2.5 the drops were 47.49% and 15.98%. In both 8K files, the 2K JPEG alone accounted for about 86% of the file. The smaller T2.5 package carried 4,163 more bytes outside the JPEG than the 7.1 file. Once triangles fit the scene, profile image bytes separately. For a strict import budget, measure exported counts and use a smaller target or test an explicit remesh stage. Then revisit the handle opening and the front outline on the final artifact, where simplification can be inspected directly.
Frequently asked questions
Which mesh would we start with for an 8,000-triangle game asset?
For this prop, the 7.1 result fit that exact geometry gate as delivered and had the closer silhouette in both measured views. The T2.5 file had a higher median triangle shape score and lower delivered bytes. If you start with that file, adjust the budget and verify the new export before import.
Does the image include every visible detail in the authored tool?
The image supplies only one front three-quarter view. The held-out rear louver and plug are missing from the tested outputs. Supply a rear reference or finish the back in the modeling tool when those items matter in gameplay.
Do these data cover deformation or a mixed prop library?
The experiment covers a single rigid accessory and one successful generation per setting. The wire and edge tests describe the topology we observed. Character deformation and a set of assets with different geometry would need separate trials.
Found this useful? Share it