Gemini 4 Argon Reactions on X: What 264 Launch Videos Show
Gemini 4 Argon reactions on X, measured: 264 launch videos, 209 creators, 3.71M views in 24 hours. Likes distribution, category mix, comparison posts vs solo, timing and bias.
Half of the Gemini 4 Argon launch videos in our collection have 21 likes or fewer. Ten posts hold 54% of all the likes. If your read on the launch came from a timeline, you saw the top of a very steep curve and not much else.
This is a data study of Gemini 4 Argon reactions on X in the first 24 hours after general availability on October 13, 2026: 264 videos from 209 creators, about 3.71M views, all from the SandBase Lab Argon collection. It’s for developers, devrel and product people who want to know what launch week actually showed. What got made, what got attention, how many posts were model-vs-model contests, and how much any of that tells you about the model.
Key takeaway
- Attention was extremely concentrated: the median post has 21 likes and 1,753 views, while the top 10 posts hold 54.3% of likes and 59.5% of views.
- 3D scenes (105 posts) and motion graphics (75) made up 68% of the collection; games were third with 48.
- 90 of 264 posts (34%) are side-by-side comparisons by our text rule, 68 of them against Claude Opus 5.5. Their median is 35 likes against 17.5 for solo posts, but they earn fewer likes per view, and the gap depends on how you define “comparison”.
- Sharing the prompt made no measurable difference: median 25 likes with a prompt, 20 without, permutation p = 0.46.
- Timing dominated everything. Posts from the first eight hours collected 85% of all likes.
Where the data comes from
SandBase Lab curates public X posts that show work made with Gemini 4 Argon and publishes them as a gallery and a JSON data file. I used the file as synced at 2026-10-14 16:29:53 UTC. Each record has the post URL, handle, text, time, likes, reposts, views, video duration, a curator-assigned category and a prompt_shared flag.
The posts run from 2026-10-13 16:00:02 UTC to 2026-10-14 16:27:53 UTC. So “October 13 and 14” is really one 24.5-hour window that starts at the top of the launch hour. Google’s announcement put Argon into general availability on the Gemini API, AI Studio, Antigravity and the Gemini app that day.
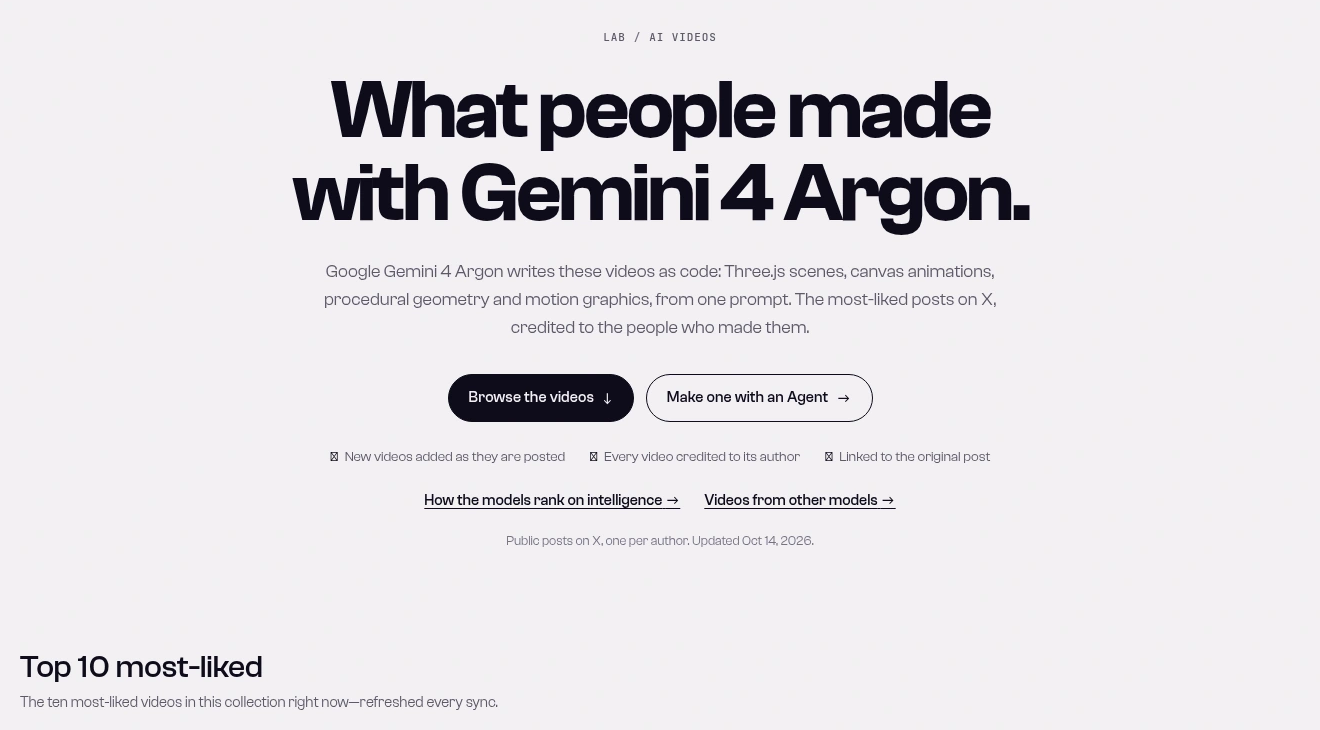
The Lab gallery is the public face of the dataset: curated public X posts, updated Oct 14, 2026 (captured 2026-10-15). The gallery shows one card per author; the data file behind it holds all 264 posts, including 39 creators with more than one.
Every number below comes from one deterministic Python script (standard library only) run against that file; the script and its full output are kept with this article’s review notes. Headline totals: 36,870 likes, 3,705,816 views and 2,167 reposts. Most posts are in English (218), then Chinese (27) and Japanese (11), with Turkish and five other languages making up the remaining eight.
Gemini 4 Argon reactions: a long-tail launch
The mean post has 139.7 likes. The median has 21. That gap is the story.
| Likes per post | Posts | Share of posts | Share of all likes |
|---|---|---|---|
| 0–9 | 78 | 29.5% | 1.1% |
| 10–49 | 106 | 40.2% | 7.1% |
| 50–99 | 22 | 8.3% | 4.2% |
| 100–499 | 43 | 16.3% | 26.2% |
| 500–999 | 8 | 3.0% | 12.8% |
| 1,000+ | 7 | 2.7% | 48.6% |
Seven posts with four-digit likes hold almost half of everything. The single top post, @fofrAI’s Fourier-epicycle pelican (4,600 likes, 478,424 views), holds 12.5% by itself. The top 10% of posts (26) hold 71.9%; the bottom half of the collection holds 3.3%.
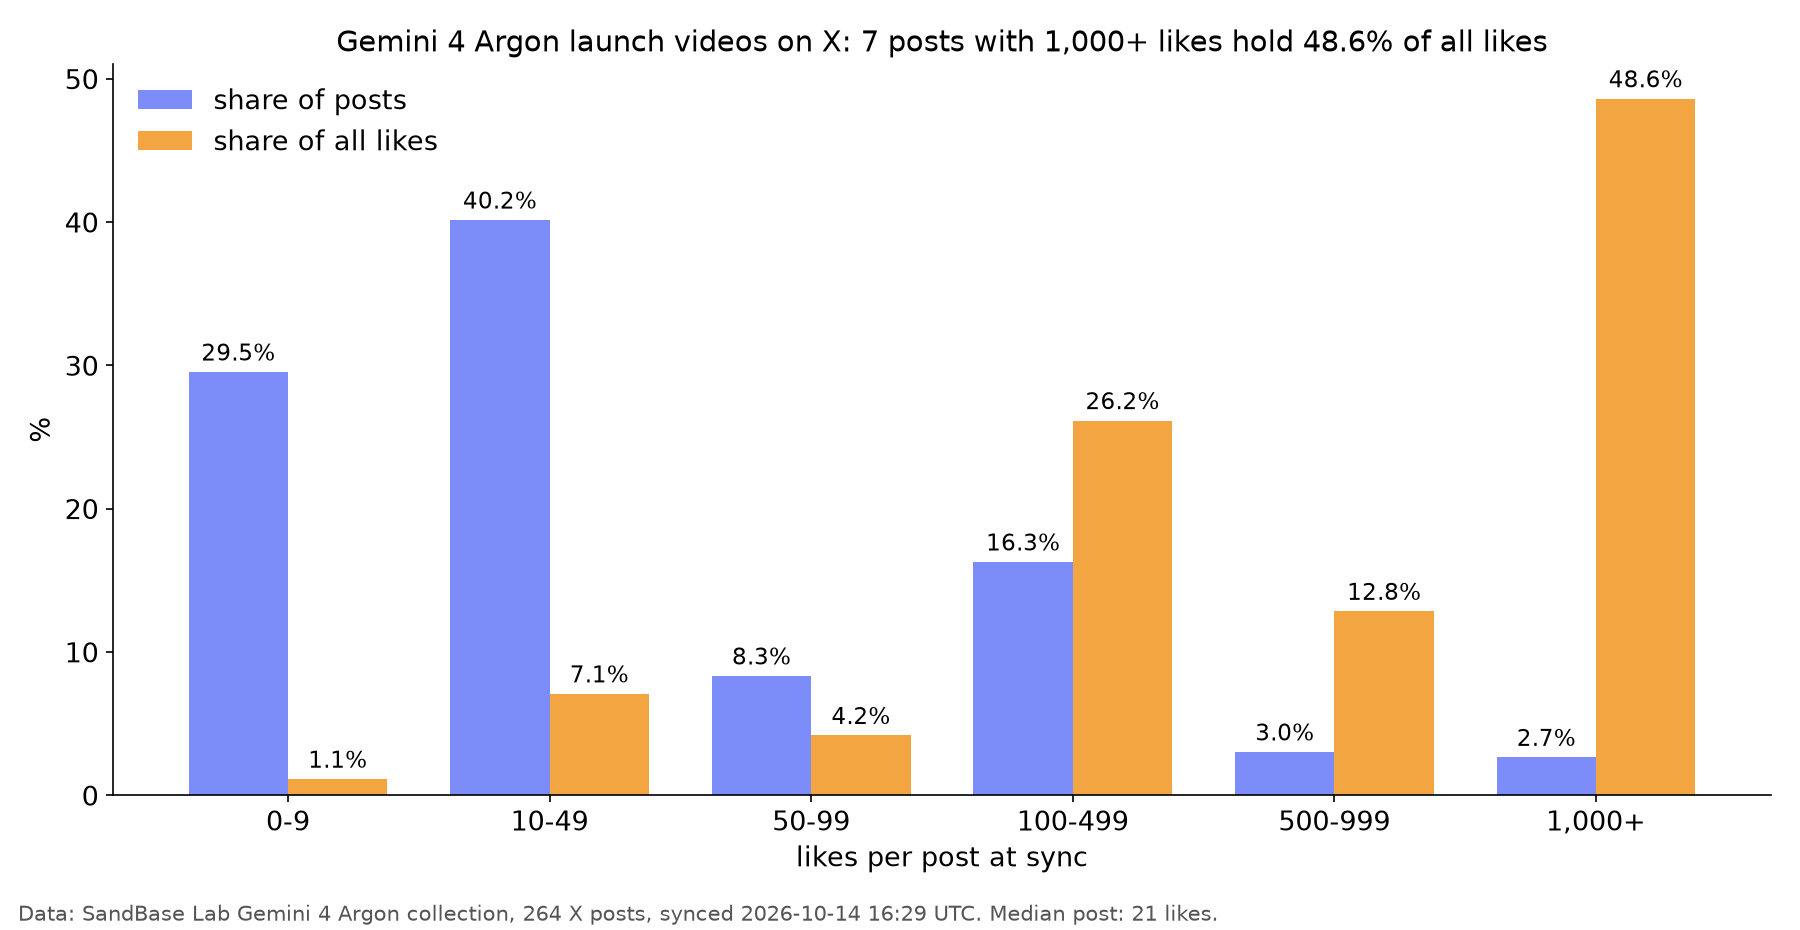
Our chart from the Lab data file: 70% of posts have under 50 likes and together collect 8.2% of the likes, while 15 posts above 500 likes collect 61.4%. Rendered with matplotlib from the 2026-10-14 sync.
Views follow the same shape: median 1,753, 90th percentile 23,611, 99th 252,593.
In practice, a few hundred people posted Argon demos, and about ten posts are what most people saw. If you judged the model from your timeline, you judged it from those ten; they’re curated here.
What people made: the category mix
Categories come from the curator, one per post.
| Category | Posts | Share | Median likes | Median views | Likes per 1k views | Share of all likes |
|---|---|---|---|---|---|---|
| 3d-scene | 105 | 39.8% | 27 | 1,700 | 13.4 | 36.3% |
| motion-graphics | 75 | 28.4% | 17 | 1,955 | 11.6 | 29.6% |
| game | 48 | 18.2% | 20 | 1,571 | 13.5 | 13.7% |
| explainer | 13 | 4.9% | 21 | 1,128 | 21.6 | 8.3% |
| ui-demo | 11 | 4.2% | 21 | 1,737 | 19.3 | 3.3% |
| particles | 5 | 1.9% | 12 | 2,009 | 16.3 | 7.1% |
| data-viz | 4 | 1.5% | 11.5 | 1,325 | 12.8 | 0.2% |
| launch-film | 2 | 0.8% | 217 | 9,818 | 18.2 | 1.2% |
| kinetic-type | 1 | 0.4% | 100 | 6,152 | 16.3 | 0.3% |
First, this is overwhelmingly visual code: Three.js scenes, SVG and canvas animation, browser games. That matches what Google said Googlers use Argon for (“complex 3D visualizations, high-fidelity games, and interactive animations in vanilla code”), and it’s also what makes a good 30-second clip. Knowledge work barely shows up, because a spreadsheet doesn’t travel on X, even though that’s where Artificial Analysis ranks Argon’s domain scores highest (Legal index #5 of 208 scored rows, v4.3, data as of 2026-10-12). The leaderboard article covers that side.
Second, category medians sit close together; 3D scenes edge ahead at 27, and the particles and data-viz medians rest on 5 and 4 posts. The particles category holds 7.1% of likes almost entirely through one post, @kickingkeys’s code paintings at 2,335 likes. With buckets this small, one viral post decides the category.
Comparison posts vs solo posts
A big share of launch week was contests: same prompt, Argon on one side, another model on the other. I wanted a number for that, which meant writing a rule down instead of eyeballing.
Detection rule. A post counts as a comparison when its text (1) names at least one non-Argon model (Opus, Claude, GPT-6, Astra, Sol, Muse Wonder, Kimi, Grok, older Gemini and others) and (2) contains a head-to-head cue: “vs”, “versus”, “compare”, “same prompt/task/scene”, “exact same”, “side by side”, “head-to-head”, “next to”, “Left:/Right:”, “N models”, “Argon and Opus”, or the Turkish, Persian, Chinese and Japanese equivalents. A post that names a rival without a cue is rival mentioned. Everything else is solo.
I then read every flagged post and every borderline case and applied 12 documented overrides. Examples: @NovaXCode (“it’s so over for opus and astra”, 259 likes) names two rivals but shows only Argon, so it stays out; @jaimintf names no rival but says Argon was “the fastest of all (same prompt)”, and the Lab frame shows three models, so it’s in. The rule reads text only; a split-screen video with a caption that names no rival is invisible to it.
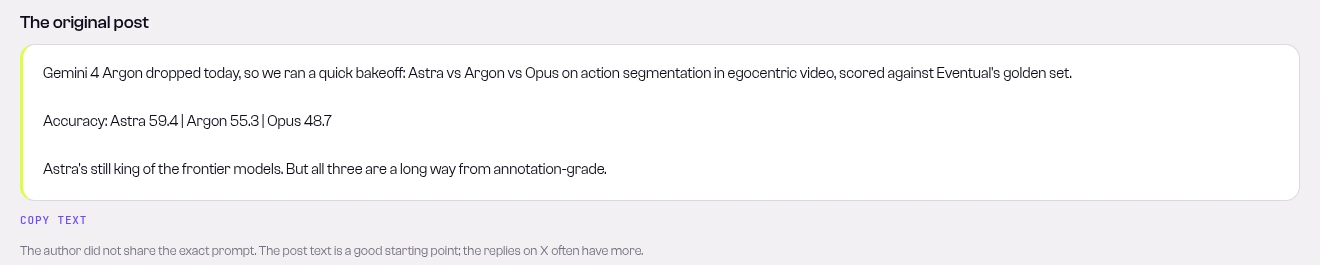
A Lab detail page keeps the full post text, which is what the comparison rule reads. This one, by @Sammy_Sidhu, fires on “vs” and names Astra and Opus (captured 2026-10-15). It’s one of the few comparisons with a scored task, and Argon finished second.
| Post type | Posts | Share | Median likes | Median views | Likes per 1k views | Share of all likes |
|---|---|---|---|---|---|---|
| Solo | 146 | 55.3% | 17.5 | 1,532 | 15.5 | 48.8% |
| Comparison | 90 | 34.1% | 35 | 2,360 | 11.6 | 47.9% |
| Rival mentioned | 28 | 10.6% | 20.5 | 1,624 | 11.7 | 3.3% |
So about a third of launch videos were contests, and they took about half the likes. Seven of the top 10 posts are comparisons, led by @semichenkko’s gummy-bear physics test, the most-viewed post in the set at 543,457 views. Opus 5.5 is named in 68 of the 90 comparisons (76%), the GPT-6 family in 29 and Muse Wonder in 13; 20 posts pit Argon against two or more rival families.
Comparisons drew a higher median (35 vs 17.5 likes; permutation test on the median, p = 0.017) and more views, but fewer likes per 1,000 views (11.6 vs 15.5). My read: a “vs” caption draws spectators who watch without liking. Comparison clips were also shorter (median 24.6 s vs 35.0 s) and three times as likely to quote a cost (32% vs 10%).
Two cautions before you quote the 35. The result is sensitive to the definition. An earlier, looser version of the rule (counting “better than”, “beat”, “against” and any post naming two rivals) flagged 104 posts with a median of 27, and the difference wasn’t significant (p = 0.12). And it’s confounded with timing: among posts more than 12 hours old at the sync, comparisons led 49.5 to 25 (p = 0.026), but among newer posts the gap was 16.5 to 12 (p = 0.42). Treat “comparisons got more attention” as likely, not settled.
Why these comparisons aren’t benchmarks
Each clip is one creator’s single run per model, in whatever harness they had (Antigravity, Devin, a chat window), judged by the poster. Effort settings, retries and editing are rarely stated. Verdicts split: in the gummy-bear clip the creator says Opus won; in @EnvolDev’s space train Argon is faster and cheaper but conceded on quality.
The gummy-bear thread also shows how quickly one run turns into many posts. Within about 15 hours, @mayaislam_ai and @jurlycat reposted the verdict and its $7.20 vs $22 costs (jurlycat credits semichenkko), and then @MiaAI_lab reran the prompt and called the original “a FAKE”, saying her Argon result was much better while Opus still edged it. Four posts, one underlying experiment, two conflicting claims, none verified by us. Counting them as four data points would be wrong.
If you need a decision, the three-way comparison runs the same prompts on all three models through one API and records the cost per task.
Does sharing the prompt or clip length matter?
52 posts (19.7%) are flagged prompt_shared, meaning the prompt is in the post or its replies.
| Posts | Median likes | Median views | Share of all likes | |
|---|---|---|---|---|
| Prompt shared | 52 | 25 | 2,073 | 7.5% |
| No prompt | 212 | 20 | 1,716 | 92.5% |
The median difference is noise (p = 0.46), and it flips by day: 37 vs 40.5 among launch-day posts, 16 vs 14.5 the next day. Only one of the top 20 shared a prompt. Posting the prompt is good citizenship; it didn’t buy reach. Those 52 prompts are analyzed in the prompt guide.
| Clip length | Posts | Median likes | Median views | Share of all likes |
|---|---|---|---|---|
| Under 15 s | 44 | 13 | 1,532 | 21.2% |
| 15–29 s | 84 | 29 | 2,142 | 26.4% |
| 30–59 s | 82 | 21 | 1,739 | 24.5% |
| 60–119 s | 46 | 20.5 | 1,560 | 26.3% |
| 120 s+ | 8 | 6.5 | 440 | 1.6% |
The median clip is exactly 30 seconds. The 15–29 s bucket has the highest median and very short clips trail, but the buckets overlap heavily, the 120 s+ bucket is 8 posts, and each main bucket’s share of likes rests on one or two viral posts. I wouldn’t tune clip length off this.
When people posted (hour by hour, UTC)
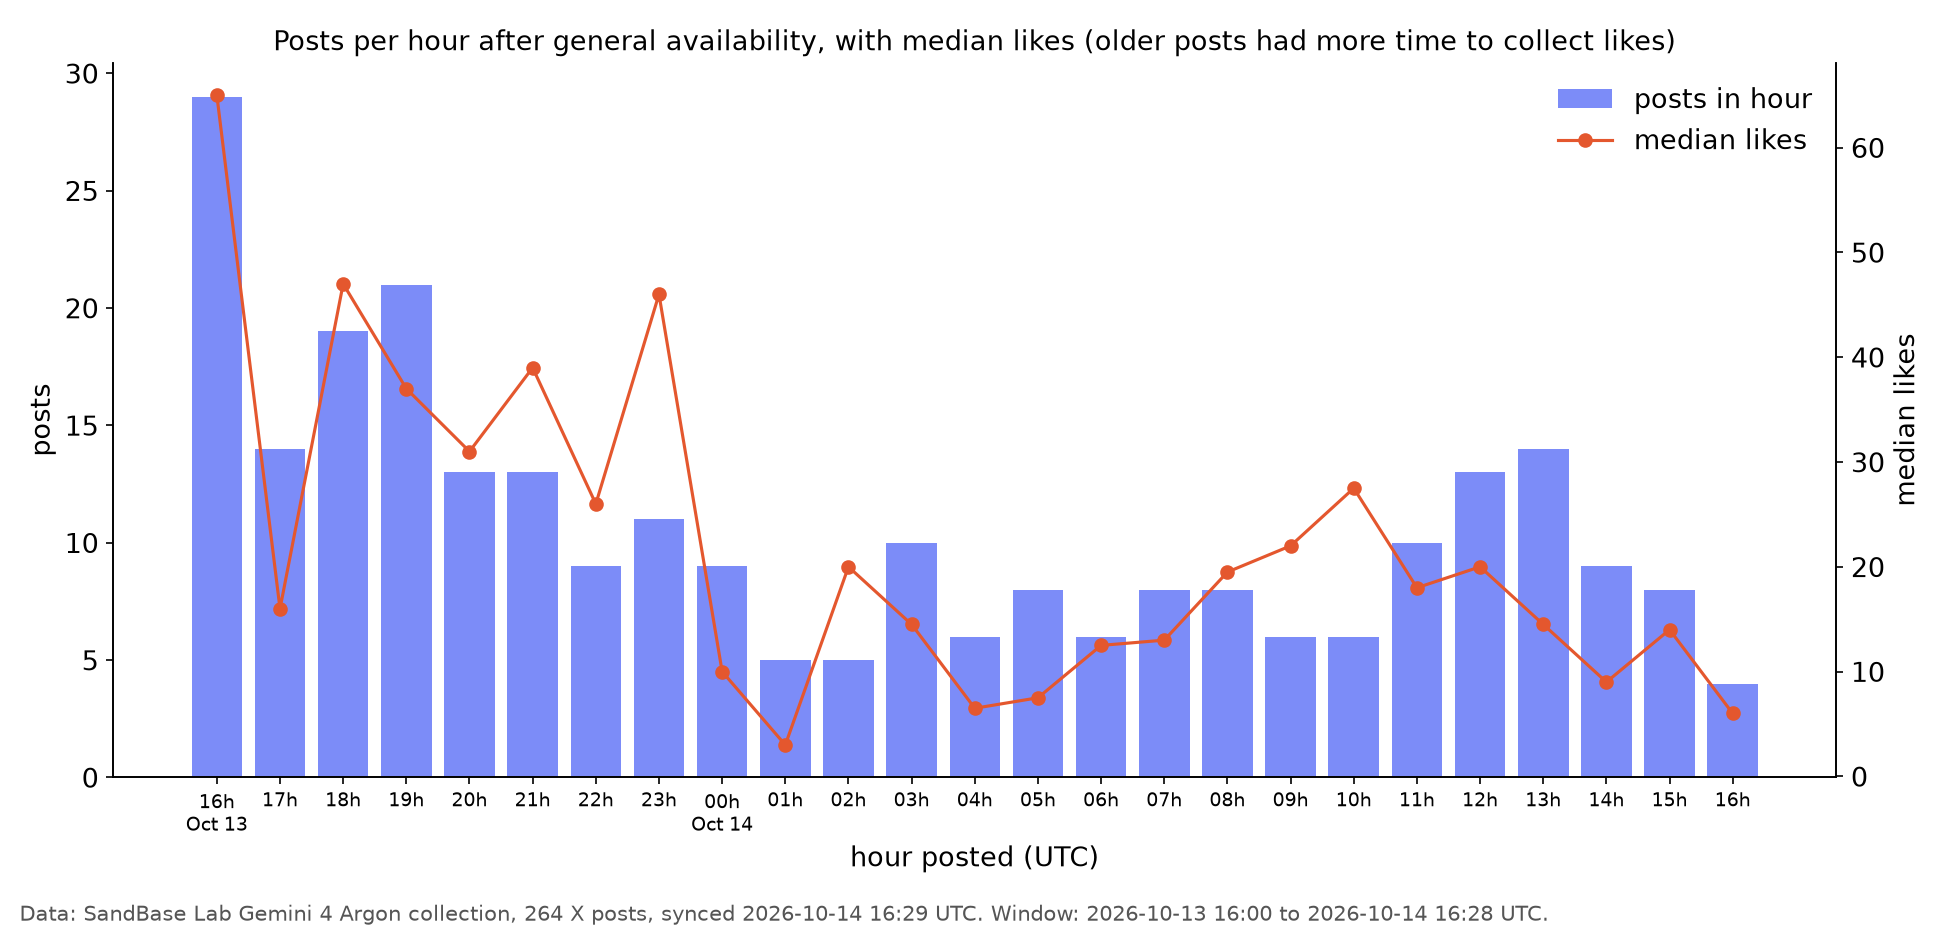
Posts per UTC hour (bars) and median likes per hour (line), from the same sync. The first hour after GA had 29 posts at a median of 65 likes; the overnight hours in the Americas dropped to 5 posts and single-digit medians.
| Block (UTC) | Posts | Median likes |
|---|---|---|
| Oct 13, 16–19 | 83 | 41 |
| Oct 13, 20–23 | 46 | 35.5 |
| Oct 14, 00–03 | 29 | 12 |
| Oct 14, 04–07 | 28 | 8.5 |
| Oct 14, 08–11 | 30 | 19.5 |
| Oct 14, 12–15 | 44 | 16 |
| Oct 14, 16 (to 16:28) | 4 | 6 |
The 16:00 hour is the launch hour, and 29 posts in it means many creators had work ready, consistent with Google’s note that Argon was available to a Fairwind early-access group from September 30. Nearly a third of the collection (83 posts) landed in the first four hours. Volume then drops through US night, picks up as Europe and Asia wake (08–13 UTC), and the window closes at 16:28 UTC, midday on the US East Coast.
Don’t read the medians as “best time to post”. Likes were frozen at one sync: a launch-hour post had 24 hours to collect them, a 15:00 post had 90 minutes. Posts older than 18 hours had a median of 39 likes; posts under 6 hours old had 15. The first eight hours (129 posts) hold 85% of all likes, which is mostly early-mover advantage plus exposure time, and the data can’t separate the two.
Methodology and selection bias
- Curated, not a census. SandBase picked these posts from X. Posts that never surfaced, private accounts and work without video are missing, and a curator choosing “work made with Argon” favors clips that look impressive.
- One snapshot. Likes and views are frozen at the 2026-10-14 16:29 UTC sync and have moved since. Newer posts are systematically undercounted.
- Curator categories. One label per post, assigned by SandBase; a 3D game could be “3d-scene” or “game”.
- Creator claims are unverified. “Made by Argon”, run times, quota and dollar figures are the creators’ statements. We didn’t rebuild any of them, and the gummy-bear dispute shows the claims can conflict.
- Comparisons are single runs. They tell you what one person saw once, in one harness.
- Small groups. Several medians rest on fewer than 15 posts. P-values come from a 10,000-shuffle permutation test on medians and aren’t corrected for the number of comparisons I ran.
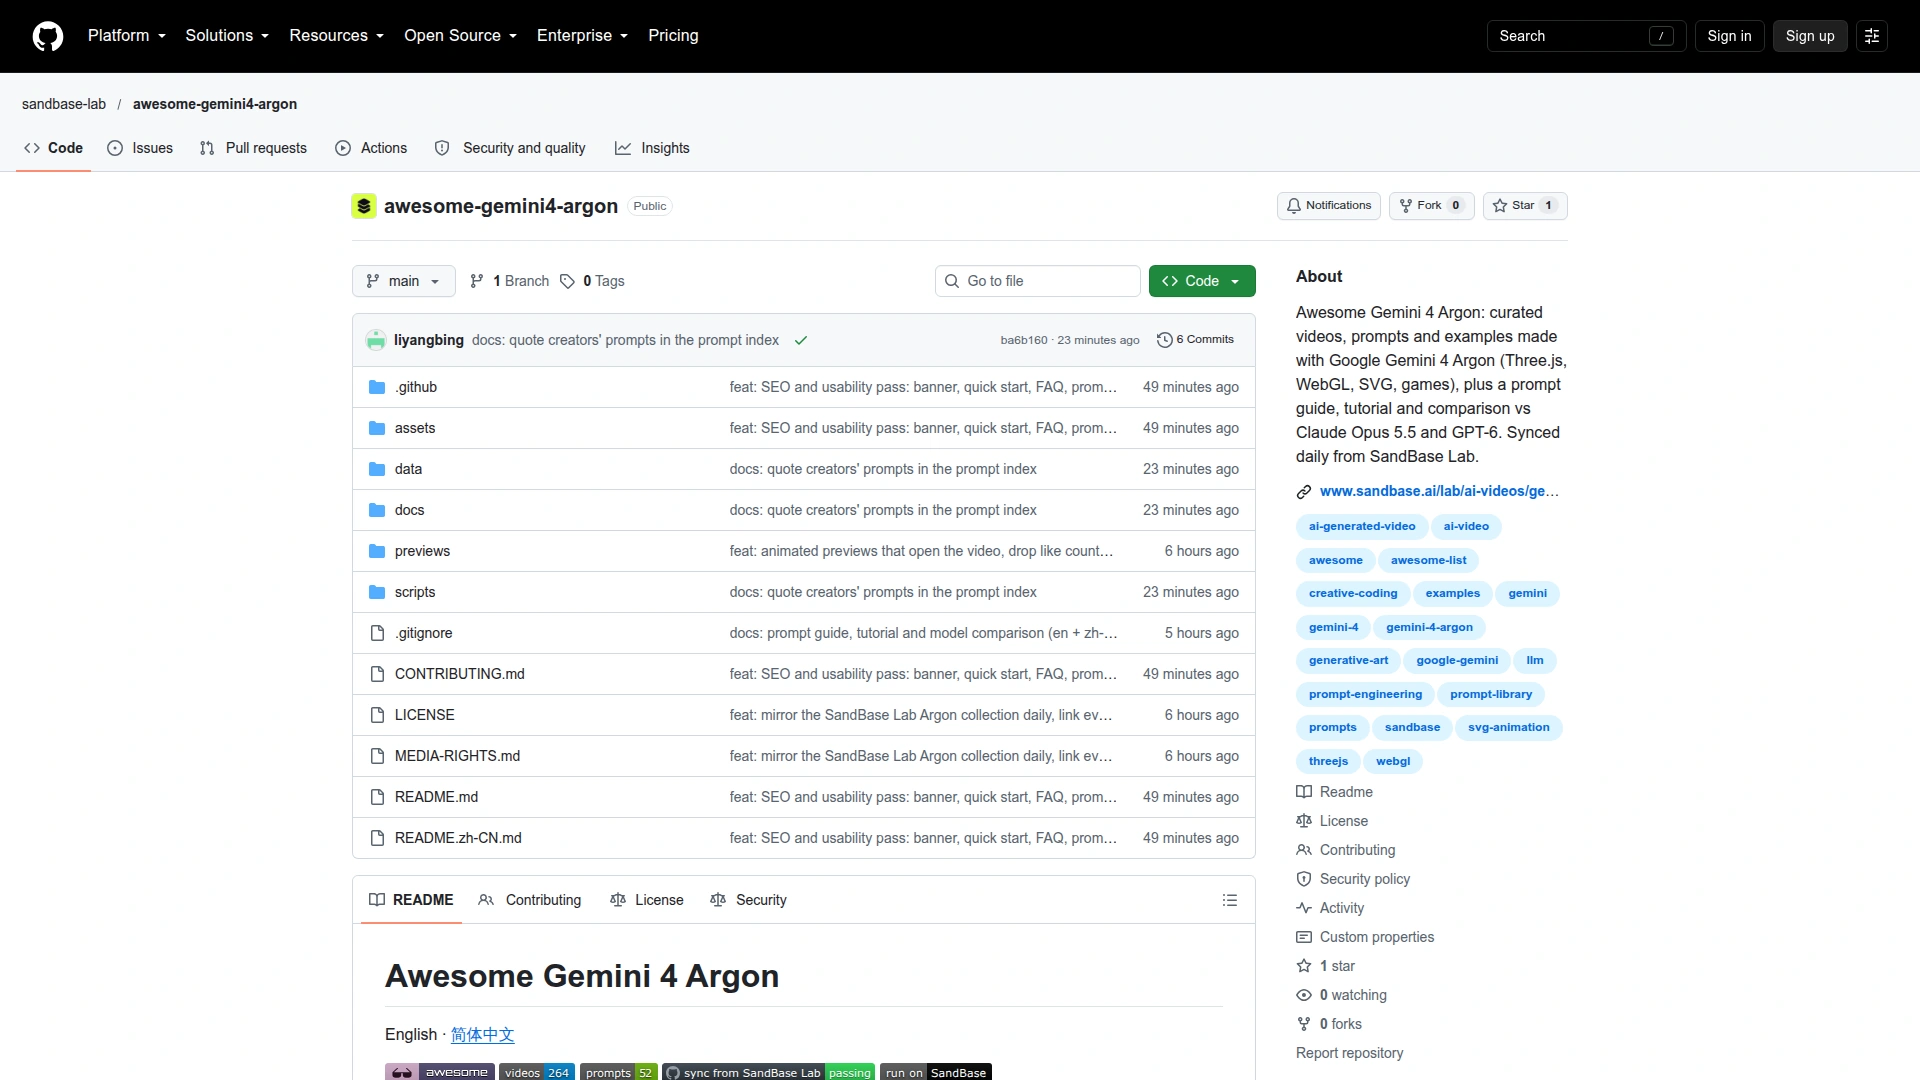
The awesome-gemini4-argon repository mirrors the same collection, and its badges match the dataset used here: 264 videos, 52 prompts (captured 2026-10-15). Videos and prompts belong to their creators.
What to take from launch week
Launch week showed that people reach for Argon to write visual code, that a third put it straight next to Opus 5.5 or GPT-6 Astra, and that a handful of early posts set the public impression. It didn’t show whether Argon is better. For that you need controlled runs, which the sibling articles do: a single-file Three.js scene, a one-prompt browser game with input tests, and the three-model comparison.
If you want to try one of these builds, the Gemini 4 Argon model page on SandBase lists $4 input / $20 output per million tokens, 1M context and a 65.5K max output per response. That’s Google’s standard rate after November 30, twice Google’s direct introductory $2 / $10; the pricing guide works through the difference. Each Lab detail page has a “Try this prompt” panel that runs on google/gemini-4-argon. For pre-GA context, see our earlier Argon API access note.
FAQ
How did people react to Gemini 4 Argon on X?
In SandBase Lab’s collection, 209 creators posted 264 videos in the first 24 hours after GA, mostly 3D scenes, motion graphics and games. About a third were side-by-side comparisons, usually against Claude Opus 5.5, and verdicts went both ways.
How many views did Gemini 4 Argon launch videos get?
About 3.71M views and 36,870 likes in total at the 2026-10-14 sync. The median post had 1,753 views and 21 likes; the top 10 posts took 59.5% of the views.
Do comparison videos prove Argon is better or worse than Opus 5.5?
No. Each is one run per model in an unstated setup, judged by the poster, and some are reposts of another creator’s run. Use them as leads for your own tests.
Did sharing the prompt get more likes?
Not measurably. Posts with a shared prompt had a median of 25 likes vs 20 without, a difference consistent with chance (p = 0.46).