Instagram Engagement Rate Checker: Features, Signals, and API Stack
How the SandBase Instagram engagement rate and fake follower checker works, what its signals mean, when to use it, and which Instagram APIs power the report.
A creator may have 400,000 followers and still be a poor fit for a campaign. Another may have 18,000 followers but generate a much more consistent response. A follower count alone cannot resolve that decision. The Instagram Engagement Rate & Fake Follower Checker turns one public username into a compact report: engagement across recent posts, a comparison with accounts of similar size, and a quality check based on a sample of recent followers.
It is most useful as a screening tool for creator research, sponsorship due diligence, competitor benchmarking, and account health checks. It is not an audit of every follower, and its fake-follower estimate should not be treated as proof that an account bought followers.
Key takeaway
- The checker analyses up to 12 recent posts and reports both average and median engagement.
- It compares the result across six follower-size tiers instead of applying one benchmark to every account.
- It samples up to 50 newest followers for profile-quality warning signs.
- A fresh report uses three public Instagram data APIs; results are cached for 24 hours.
- The follower-quality result is a screening signal, not a definitive count of fake accounts.
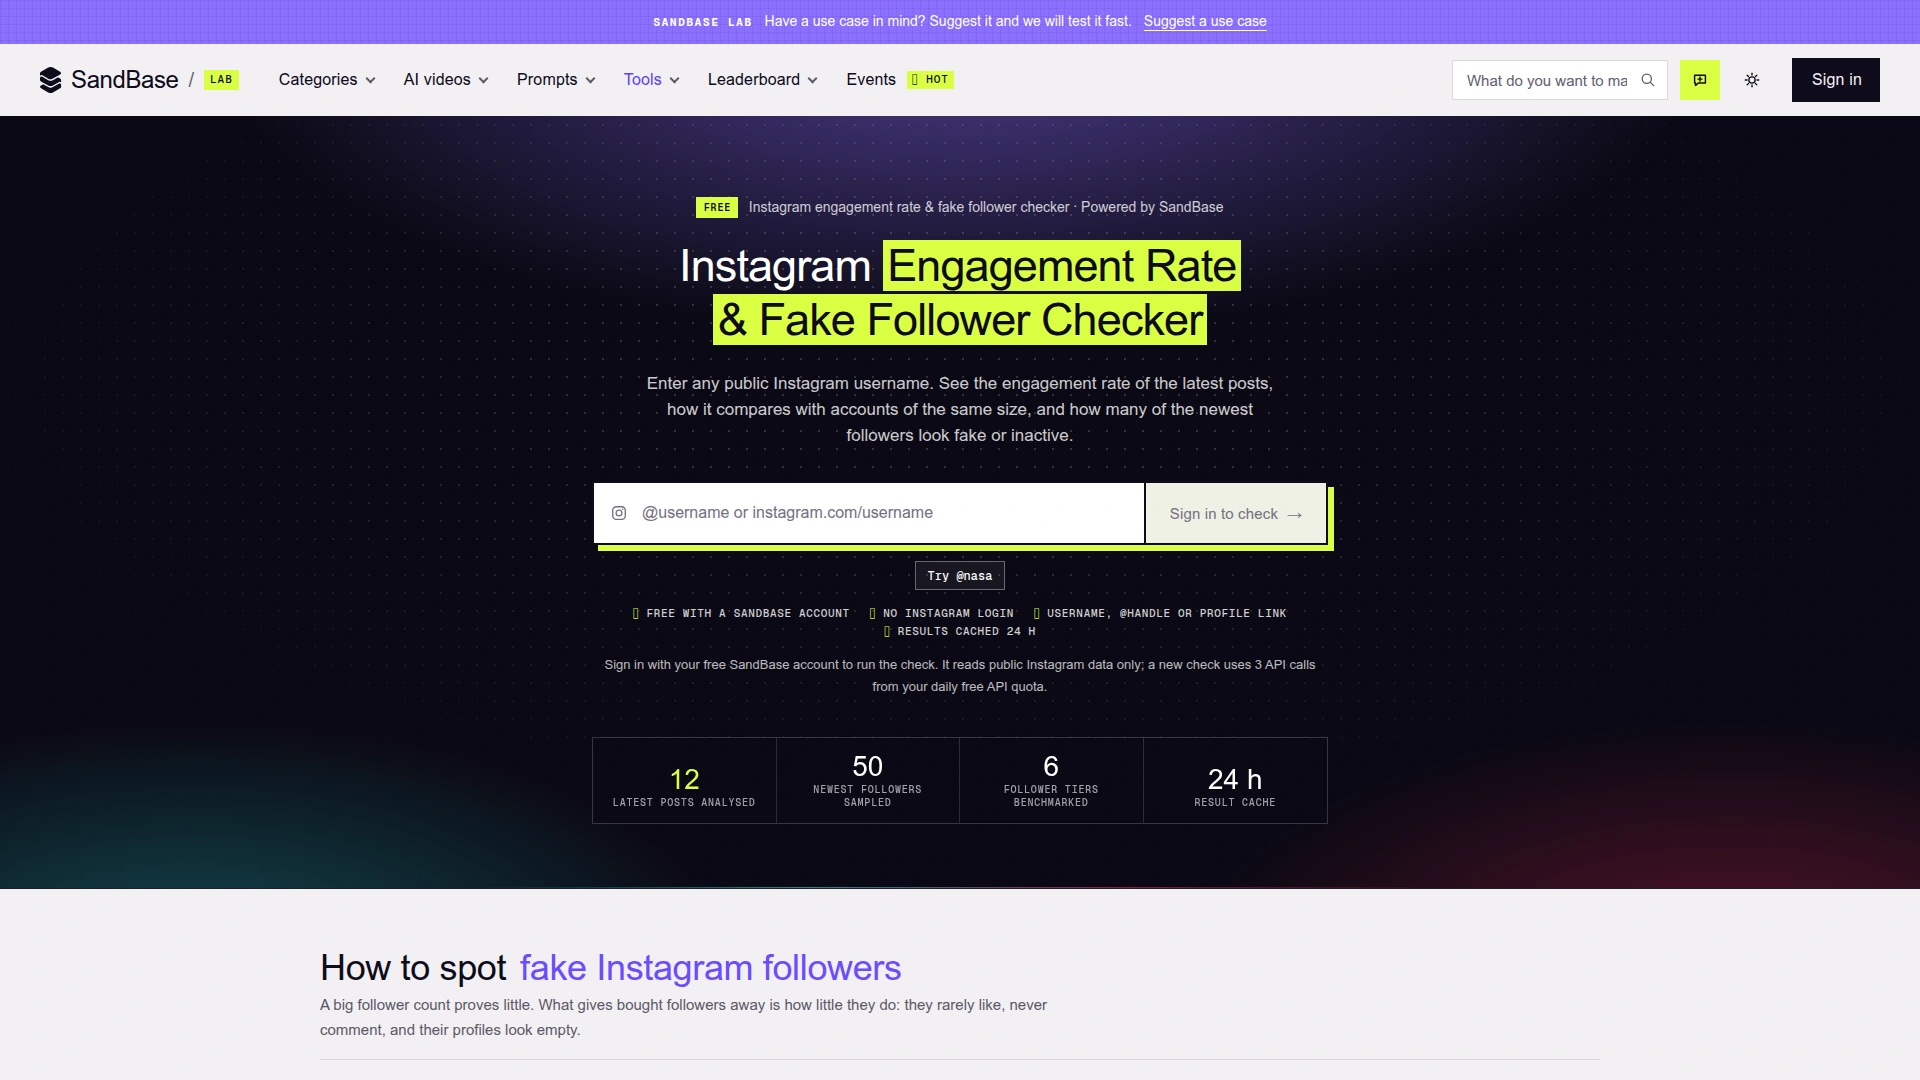 The live checker accepts a public username or profile URL and states its working limits: 12 recent posts, a sample of 50 newest followers, six comparison tiers, and a 24-hour cache. Captured October 30, 2026.
What the checker does
The tool combines three questions that are often answered separately.
First, do people interact with the account’s recent content? For each of the latest 12 posts, it divides likes plus comments by the account’s follower count. Posts with hidden like counts are excluded. It then averages the per-post rates and also shows the median. That second number matters: one viral Reel can pull the average upward, while the median better represents a typical post.
Second, is that rate plausible for an account of this size? Engagement generally falls as audiences grow, so comparing a 7,000-follower niche creator with a celebrity account is not meaningful. The checker places the account into one of six follower tiers and compares like with like. Its published rule-of-thumb bands range from roughly 2.5–6% below 10,000 followers to roughly 0.2–1% above 10 million. These are the tool’s comparison bands, not universal Instagram standards or a guarantee of campaign performance.
Third, does a sample of recent followers contain obvious low-quality signals? The checker looks at up to 50 newest followers and flags patterns such as no profile photo, no name, or an auto-generated-looking handle. These are useful reasons to inspect an account more closely, but none of them proves that an individual follower is fake. New users, private people, and inactive real accounts can look sparse too.
The important design choice is that the report does not collapse everything into follower count. It puts content response, audience size, and a bounded follower sample next to one another. That makes the result easier to use as a first-pass decision.
Feature highlights
Average and median, not one flattering number
Engagement dashboards often lead with a single percentage. The checker’s average answers “what was the mean response across the observed posts?” The median answers “what did the middle post look like?” When those figures diverge sharply, the account may rely on a small number of outliers. That is a cue to open the post list and understand which format, topic, or collaboration caused the spike.
The calculation is follower-based rather than reach-based because public profile and post surfaces expose follower and interaction counts, not owner-only reach or impressions. For a brand that owns the account, Instagram’s authenticated Insights data remains the better source for reach-based analysis.
Size-aware benchmarking
A 1% rate does not mean the same thing for every account. On a small specialist account it may be weak; on a multi-million-follower account it may be healthy. The six-tier comparison reduces that category error and gives campaign teams a faster way to shortlist accounts within the same audience-size band.
This is still a heuristic. Geography, niche, content format, posting frequency, giveaways, paid amplification, and comment quality all affect the number. Use the band to find anomalies, then inspect the posts behind them.
A transparent, limited follower-quality sample
The checker says exactly what it samples: up to 50 of the newest followers. That boundary is a strength because it prevents an estimate from masquerading as a census. The newest-followers slice can reveal a sudden cluster of empty profiles, but it can also overrepresent new or inactive users. A high warning rate should trigger deeper review, not an accusation.
Low-friction input and a reusable report
The input accepts a username, @handle, or Instagram profile link. No Instagram login is required because the report reads public surfaces only. A SandBase account is required to run a new check. If someone checked the same username within the previous 24 hours, the cached report is reused instead of consuming another set of API calls.
Caching is especially helpful for campaign teams that share a shortlist. Everyone sees the same dated snapshot, and repeated page refreshes do not turn into repeated upstream requests. The trade-off is intentional staleness: the tool is for screening and periodic monitoring, not minute-by-minute analytics.
Who should use it
Creator and influencer shortlisting
Start with a list of candidates, run the same check for each public account, and compare within similar follower tiers. A practical shortlist records the report timestamp, average rate, median rate, sampled-follower warning level, and a note about obvious outlier posts. This helps a marketer move beyond “largest audience wins” without pretending that one score predicts sales.
Sponsorship due diligence
Before requesting a media kit, the checker can surface questions worth asking. A large gap between average and median may indicate that a few viral posts dominate. Very low engagement for the account’s size plus an unusual concentration of sparse new followers may justify a closer look. The next step is corroboration: review comment relevance, posting history, audience geography supplied by the creator, and first-party campaign data.
Competitor and category benchmarking
Teams can build a small, fixed cohort of public accounts and capture reports on a regular schedule. The useful output is not a universal leaderboard; it is a dated comparison of similar accounts in one niche. Keep the cohort, observation date, and selection rule constant so a change in methodology is not mistaken for a change in performance.
Monitoring your own public account
For an account owner, the public-view report is a quick outside-in check. It shows what a prospective sponsor or competitor can infer without privileged access. Use it alongside, not instead of, authenticated Instagram Insights. Insights can answer questions about reach, impressions, saves, audience demographics, and conversions that public data cannot.
Building an internal scoring workflow
Developers can reproduce the data-gathering layer and add their own rules: a different observation window, separate Reels and image-post cohorts, comment-quality review, or campaign-specific weights. The checker itself demonstrates a sensible boundary: collect public profile, recent-post, and recent-follower data, calculate scores locally, and display the limitations next to the result.
The three API dependencies
The checker is built on three endpoints in the SandBase Instagram API catalog. Each accepts a public Instagram username and is called through the SandBase Platform API. A fresh check uses one call to each endpoint.
| Dependency | Role in the checker | Direct API page |
|---|---|---|
instagram/v3/user-profile | Supplies the public profile and follower count used as the denominator and tier input | Instagram User Profile (V3) |
instagram/v3/user-posts | Supplies the recent-post cohort and public like/comment counts used in the engagement calculation | Instagram User Posts (V3) |
instagram/v3/user-followers | Supplies the bounded newest-follower sample used for profile-quality signals | Instagram User Followers (V3) |
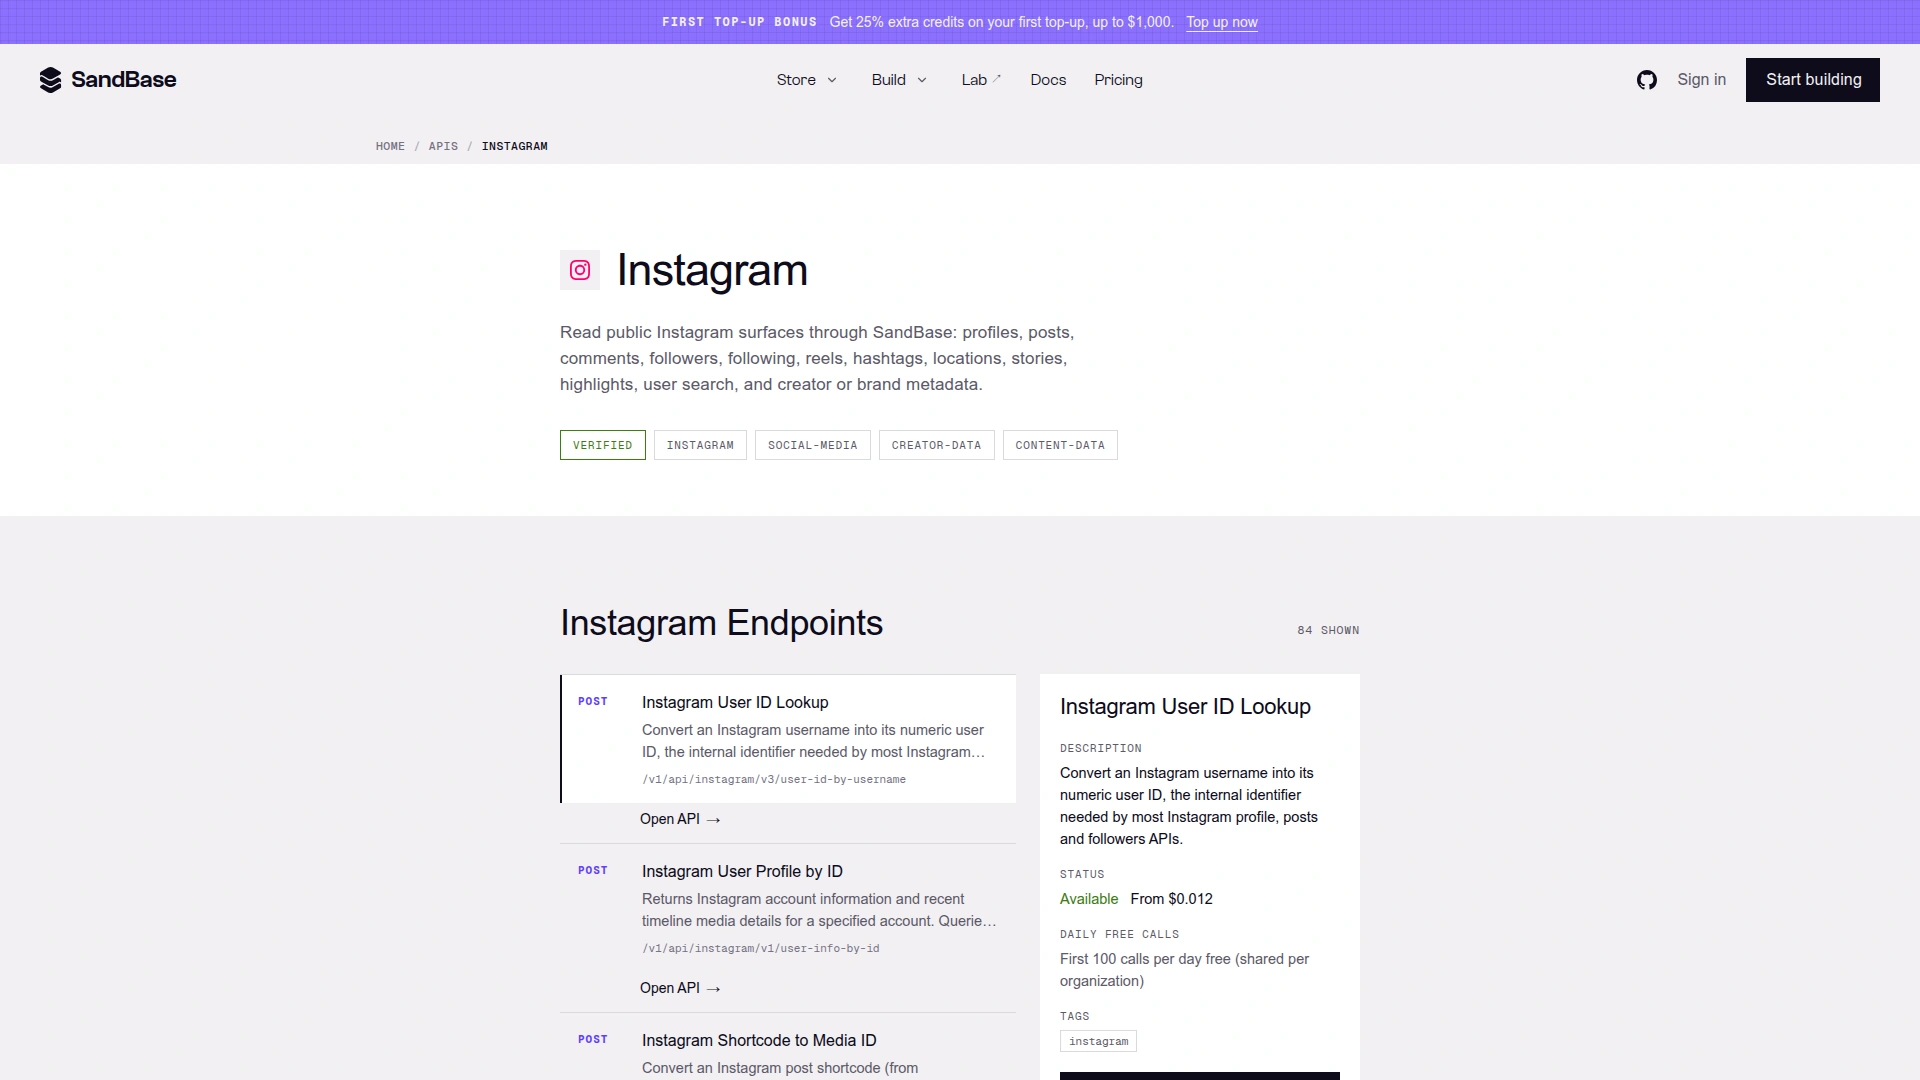 The Instagram catalog groups public profile, post, follower, Reel, comment, hashtag, and other endpoints under one provider. The live page showed 84 endpoints when captured on October 30, 2026; the dependency table above names only the three used by this checker.
The catalog is the discovery surface, while each direct API page is the implementation surface. The latter records the production route, request parameters, price, response format, and Playground. For platform data calls, the documented route is POST https://api.sandbase.ai/v1/api/<model>, authenticated with a Bearer API key. Completed SandBase responses wrap the business payload at outputs[0].data.
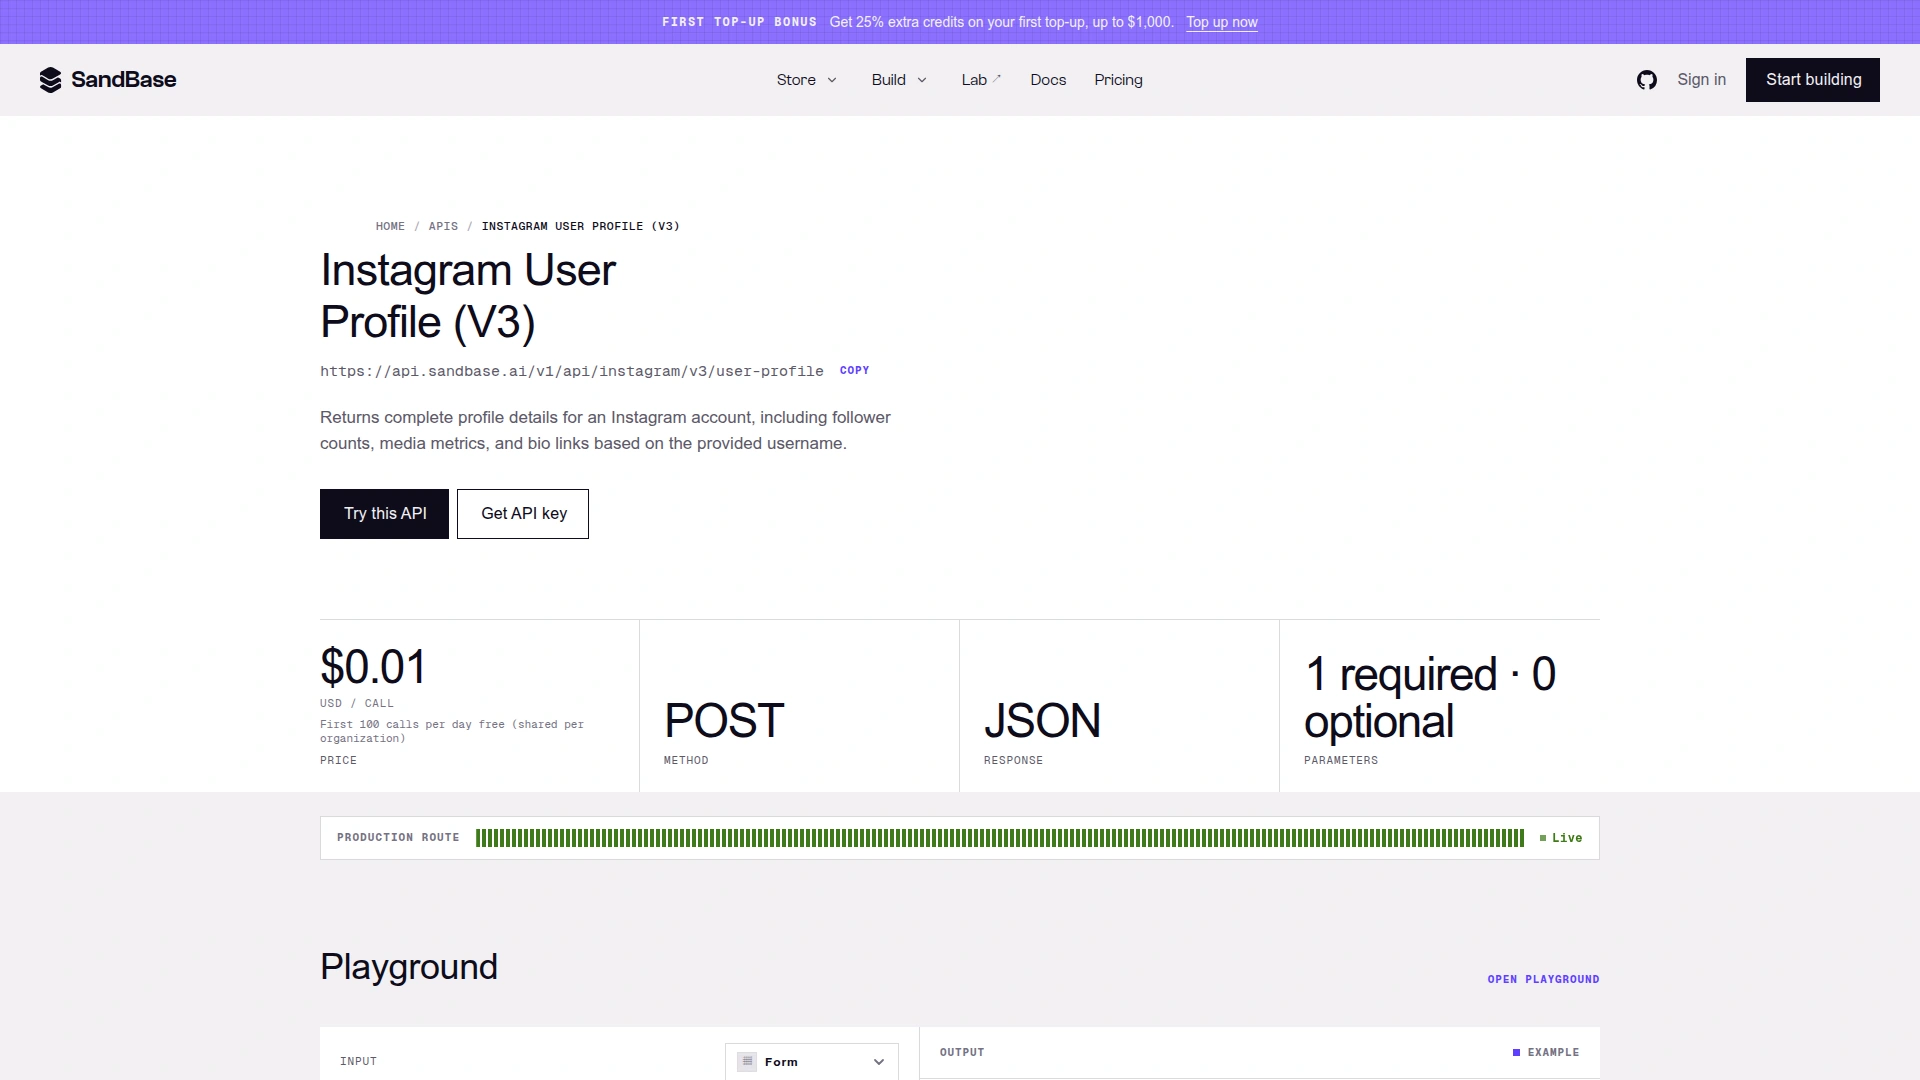 The profile dependency exposes a synchronous POST route with one required username. The page showed $0.01 per call and the first 100 eligible API calls per organization per UTC day free when captured on October 30, 2026; current pricing should always be checked on the API page.
The public API pages establish the transport and parameter contract. Nested Instagram business fields can change upstream, so production code should read them defensively and treat observed payload fields as version-sensitive. Do not assume that a UI’s derived score is itself returned by an endpoint: the engagement rate, benchmark comparison, and follower-quality estimate are application-layer calculations built from the three source payloads.
How to read the result without overclaiming
A useful review separates observations from interpretations.
| Result | Safe interpretation | What it does not prove |
|---|---|---|
| Average and median are both strong for the size tier | Recent public posts received consistent visible interaction | Future campaign reach, conversions, or sales |
| Average is much higher than median | One or more posts may be outliers | The account manipulated engagement |
| Rate is low for the size tier | Recent visible interaction is weak relative to the tool’s band | Followers are fake |
| Many sampled followers have sparse profiles | The newest-follower sample deserves closer review | The same share applies to the full audience |
| Private account cannot be analysed | Required posts or follower surfaces are not public | Anything about the account’s real performance |
This distinction is the main safeguard. “Fake follower checker” describes the user problem, but the actual method is a quality estimate from a small, recent sample combined with engagement context. The tool itself states that the score should guide inspection rather than serve as proof.
Limits that matter in real decisions
- Public accounts only. Private-account posts and followers are not available to the checker.
- Visible interactions only. Hidden likes are excluded, and public data does not include reach, impressions, saves, shares, or conversions.
- A short recent window. Twelve posts are useful for a current snapshot but may miss seasonality or older content formats.
- A sample, not a census. Up to 50 newest followers cannot represent every audience segment with statistical certainty.
- A 24-hour cache. Reports are dated snapshots and may not reflect a change that happened minutes ago.
- Heuristic benchmarks. Size tiers make comparisons fairer, but niche and format still matter.
For a production creator-selection process, combine the report with manual content review, authenticated first-party analytics supplied with consent, campaign objectives, brand-safety checks, and post-campaign outcome data.
A practical decision workflow
- Define a comparable cohort: same category, market, and approximate audience size.
- Run the checker for each public account and record the timestamp.
- Compare average with median before looking at the headline rate.
- Open outlier posts and identify why they differ from the account’s normal content.
- Treat follower-quality warnings as questions to investigate, never as allegations.
- Ask shortlisted creators for first-party reach, audience, and prior-campaign evidence.
- Save the decision rationale so the same criteria can be applied in the next campaign.
If the goal is broader automation rather than a one-off check, the Instagram public data API guide explains the wider endpoint landscape, while the Instagram profile research tutorial shows how profile and post data can be combined in a repeatable workflow.
FAQ
How is the Instagram engagement rate calculated?
For each of up to 12 recent eligible posts, the checker calculates (likes + comments) / followers, then reports the average of those per-post rates and the median. Posts with hidden likes are excluded.
Is the fake follower percentage exact?
No. It is an estimate based on up to 50 newest followers and visible profile-quality signals. It is useful for deciding where to investigate, not for asserting how many followers were purchased or automated.
Does the checker work on private accounts?
No. The calculation depends on public posts and a public follower sample.
Why does a new check use three API calls?
The report needs three different data surfaces: the profile for follower count and account context, recent posts for visible interactions, and recent followers for the bounded quality sample.
Can developers call the underlying APIs directly?
Yes. The dependency table links the profile, posts, and followers API pages. Developers can use those endpoints to gather the public source data, then implement their own documented calculations and review rules.
Bottom line
The checker is valuable because it answers a narrow question quickly: does this public account’s recent engagement and newest-follower sample look consistent with its size? Its best features are the paired average and median, size-aware comparison, explicit sample limits, and transparent three-API foundation. Use it to screen and prioritize. For consequential campaign or fraud decisions, verify the signal with deeper evidence.