TikTok Fake Views Detection: A 68-Video Test of One Detector
TikTok fake views detection, tested: 68 public videos through one detector API. What drives its score, how stable it is, and why video age beats likes.
TikTok’s own account posted a video that has 162 million views. We ran it through a fake-view detector and got back a fake score of 4.34 out of 100, “not suspicious”, confidence “Minimal”. The same report also said 8,102,335 of those views were estimated fake, and that the account had “suspiciously” grown from 10,000 to 100,000 followers in 31 days.
Both statements come out of one JSON response. So before anyone uses this kind of report to argue with a creator about a paid deal, it is worth knowing what the detector actually reacts to. On 2026-10-04 (UTC) we sent 68 public TikTok videos through tiktok/analytics/detect-fake-views on SandBase, re-ran 10 of them up to three more times, and ran 13 of them under all five content_category values: 163 completed reports in the study, plus a handful of example runs.
Key takeaway
- The detector called none of the 68 videos suspicious. Its fake_score ranged from 5.92 to 47.53, median 19.66; 66 of 68 came back with confidence “Minimal”.
- fake_view_percentage is a step function of fake_score: 5% below a score of 10, then 10, 20, 30 or 40%. estimated_fake_views is simply views × that step, and the revenue figure is that number × $1 per 1,000 views. Every clean-looking video still gets at least a 5% “fake” estimate.
- Video age was the strongest single predictor we measured (Spearman 0.69 with fake_score). Videos older than two days had a median score of 29.53; younger ones 10.66. The view-distribution check drives most of that, and it can flip within an hour: 5 of 10 re-tested videos jumped 10.5 to 12.4 points between 01:50 and 02:15 UTC.
- content_category did nothing for the verified brand accounts we tested (they were always benchmarked as
verified_large). For unverified videos it moved the score by 2.3 to 9.7 points.- We have no labeled set of videos with known fake views, so this measures behavior, not accuracy. Treat the output as a screening signal and a list of things to check, not as evidence of fraud.
What we tested, and what we didn’t
The question is narrow: what does this one detector respond to, and does it answer the same way twice? Judging TikTok fake views detection for accuracy would need ground truth, videos where someone knows how many views were bought. We don’t have that, so everything below describes behavior, not correctness.
The detector is a third-party heuristic. Its upstream vendor is TikHub, and its reference page says it is based on “TikTok’s Traffic Pool theory”. It is not TikTok’s own data, and a high score is not proof that anyone bought views.
Sample (68 videos, listed 2026-10-04 01:18 UTC):
| Group | How we picked | n | Named in this article? |
|---|---|---|---|
| Brand and media accounts | Latest 3 regular videos from each of 12 official accounts via tiktok/app-v3/user-post-videos: TikTok, Nike, NBA, Netflix, ESPN, Red Bull, Sephora, Duolingo, NFL, Chipotle, The Washington Post, Ryanair | 36 | Yes, by brand |
| Search results | First 8 unverified-creator videos for 4 generic US keywords (food, beauty, fitness, education) from the last 30 days via tiktok/app-v3/video-search-result | 32 | No. Aggregates only, labelled “Video A” etc. |
We publish no ids, handles or captions from the search group. All 36 brand videos came from accounts with 2.1M to 96M followers (the detector’s xlarge and xxlarge tiers). The 32 search videos spread from micro to xlarge.
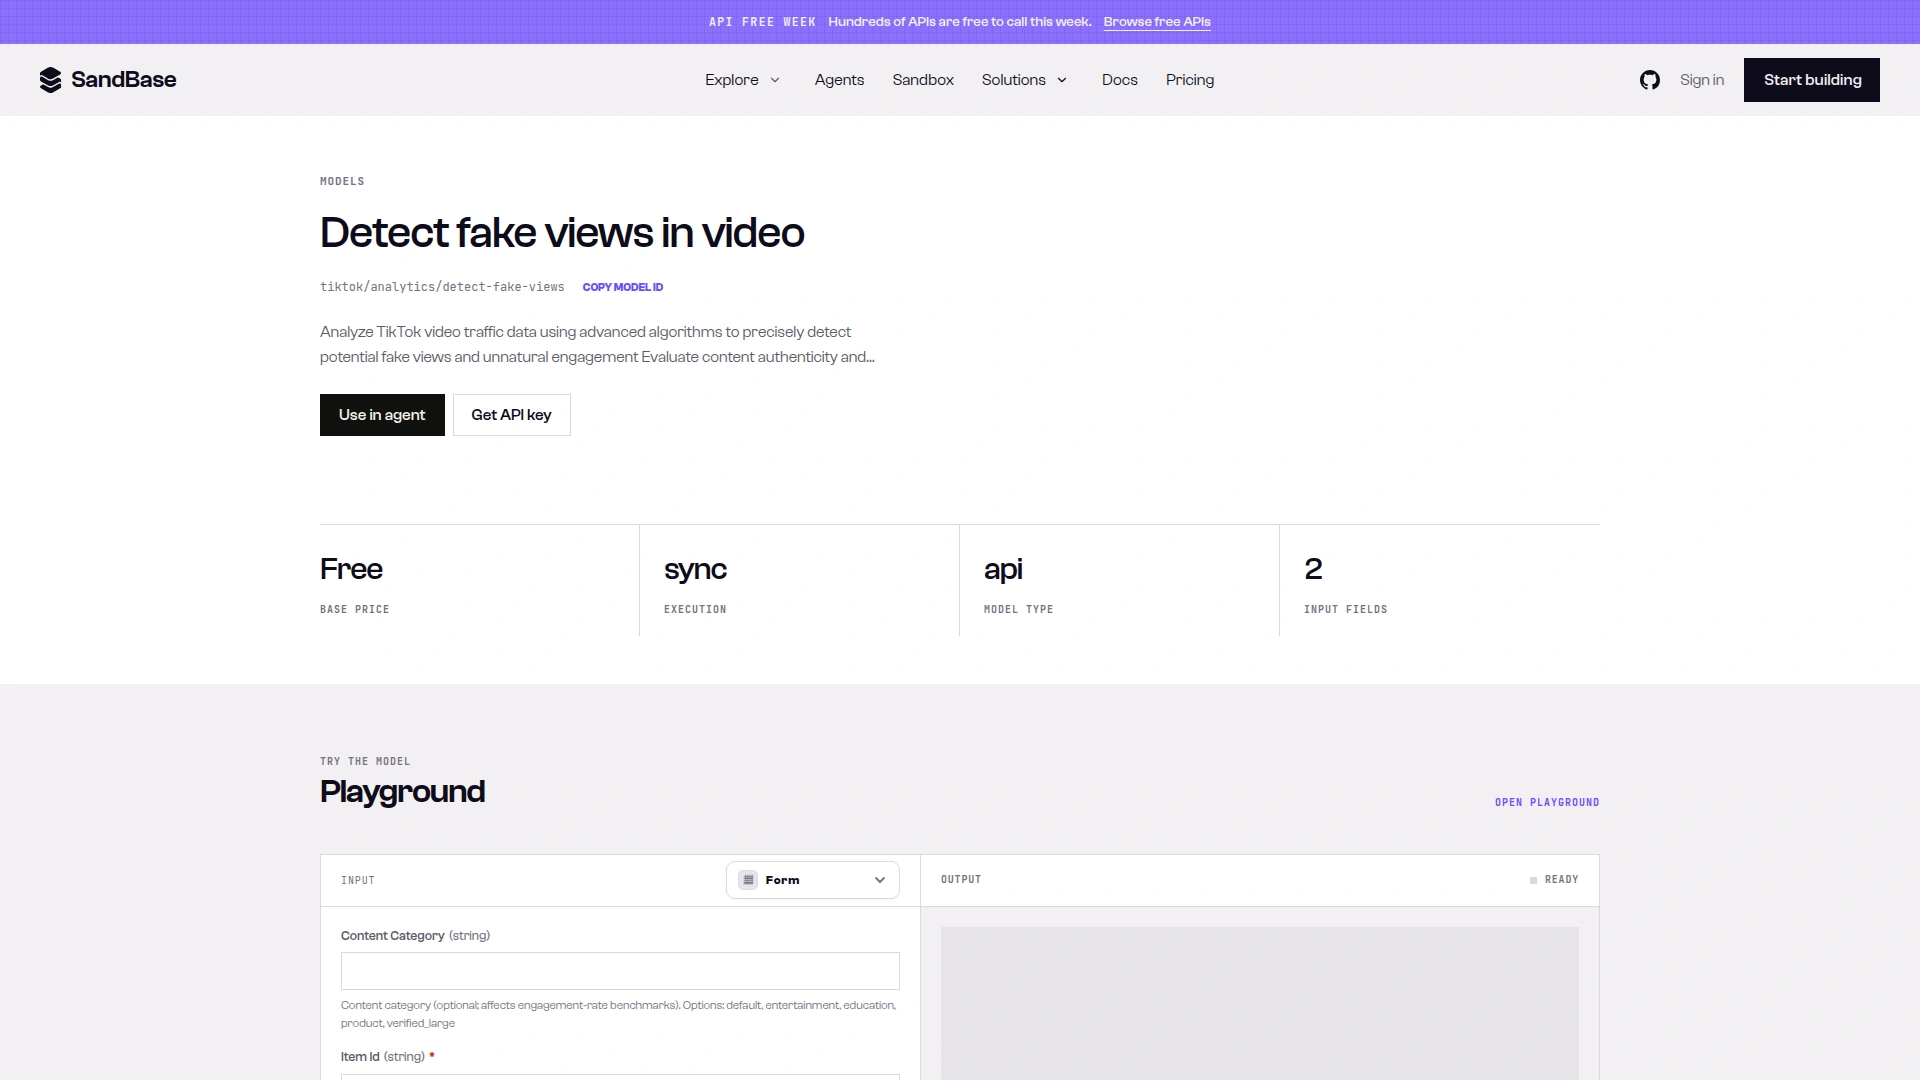
Caption: The model page for tiktok/analytics/detect-fake-views showed a Free base price, sync execution and two inputs, under an “API Free Week” banner (captured 2026-10-04).
Cost: GET https://api.sandbase.ai/v1/models/tiktok/analytics/detect-fake-views returned base_price "0" at 01:16 UTC, and so did the two listing endpoints. GET /v1/tasks/621146a2-cf67-4dcf-a9e8-a15a63830cea/cost billed one detector run at $0.000000. Both lookups need the same Authorization: Bearer key as the calls; the public model page shows the price without one. With the banner up, we can’t say Free is permanent. The whole study, screenshots included, cost about $0.015.
The score never said “suspicious”
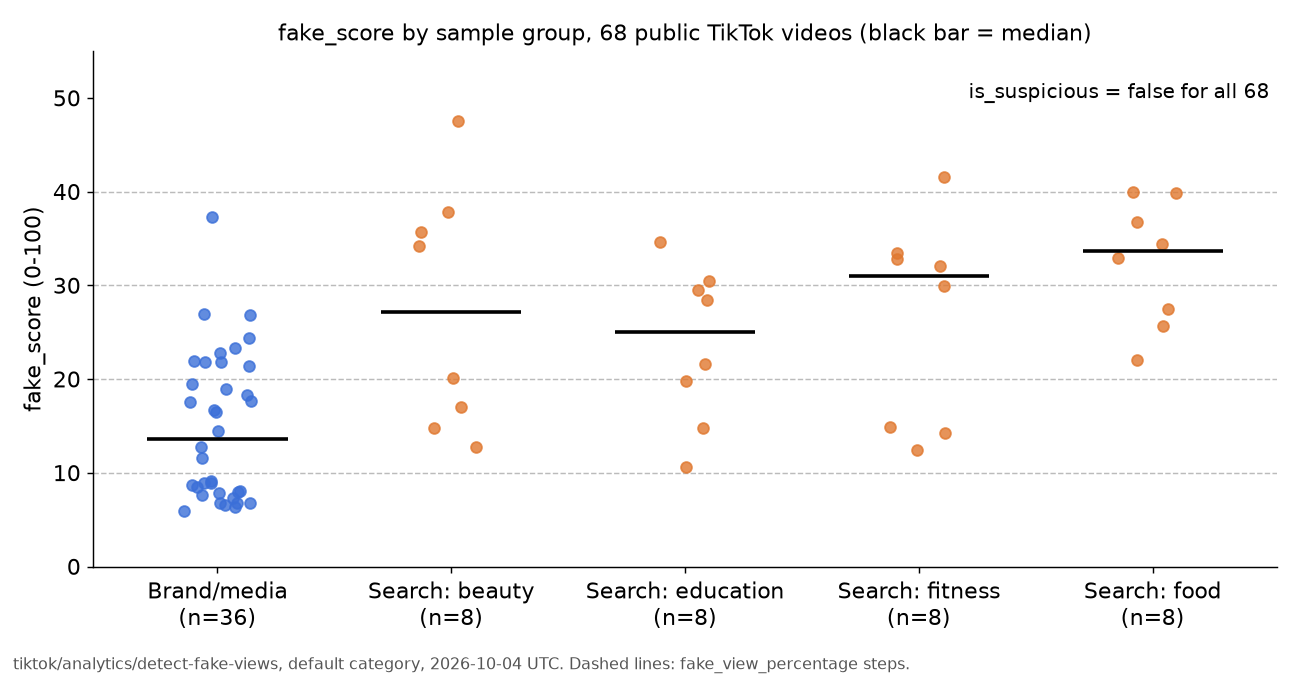
Caption: fake_score for all 68 videos under the default category; brand videos had a median of 13.6, the anonymized search videos 29.74, and no video was marked suspicious (charted from our 2026-10-04 runs).
| Brand / media (36) | Search results (32) | |
|---|---|---|
| fake_score median (p25 to p75) | 13.6 (7.93 to 21.5) | 29.74 (19.1 to 34.48) |
| Range | 5.92 to 37.36 | 10.66 to 47.53 |
is_suspicious: true | 0 | 0 |
| Confidence “Low” (rest “Minimal”) | 0 | 2 |
Videos with a “Critical:” line in suspicious_features | 7 | 19 |
Alarms and verdict are separate things. 55 of 68 reports listed at least one “Suspicious:” or “Critical:” feature, 26 of them a “Critical:” one, and every report still said is_suspicious: false. One Nike video, for example, carried “Critical: Like Ratio is extremely low (0.00473 vs minimum 0.00500)” with a fake_score of 37.36. The lines are per-check alarms against fixed thresholds; the verdict is a cut-off nothing in our sample reached (top score 47.53).
The follower-growth alarms are the clearest case. 18 of 36 brand videos carried one, including TikTok (“100,000 followers from 10,000 in only 31 days”), Duolingo (“1,000,000 followers from 500,000 in only 20 days”) and NFL (“Followers grew 10.0x in only 2 days”). They look like early account history, and they barely move the score.
What actually moves fake_score
Each report has eight component_scores. A plain linear fit of fake_score on those eight explains almost all of it (R² 0.956 across the 68 default runs), with these weights: engagement 0.26, creator credibility 0.23, distribution 0.22, follower correlation 0.15, consistency 0.10, and close to zero for fan growth and content authenticity. That is our fit, not a published formula.
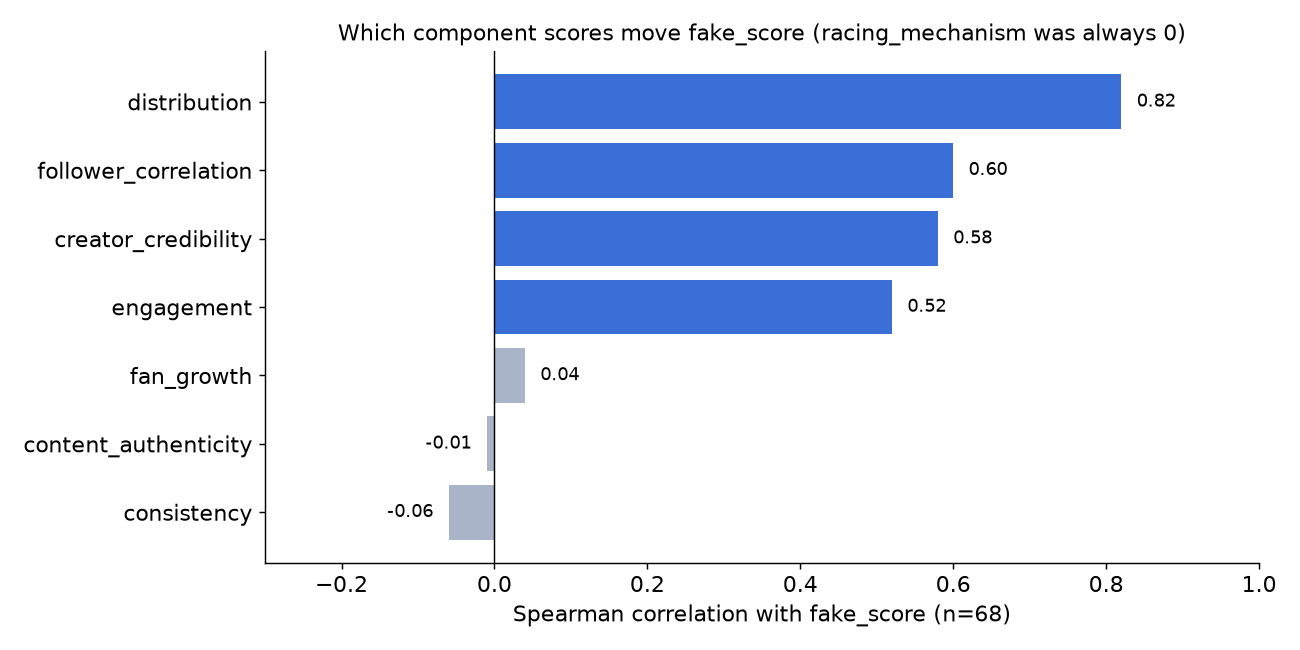
Caption: Distribution, follower correlation, creator credibility and engagement track fake_score; fan growth, content authenticity and consistency barely do, and racing mechanism was 0 in every run (charted from our 2026-10-04 runs).
What each one did in our sample:
- Distribution (the view-history check) took only five values: 0, 10, 60, 65 or 80. A “natural” pattern gives 10; “low entropy”, “statistical anomaly” or “growth anomaly” gives 60 to 80. On its own that jump adds roughly 11 to 15 points.
- Creator credibility was 0 for all 36 verified brand videos and 3 to 55 for most unverified creators. Being verified removes this term.
- Follower correlation was 20 for 35 of 36 brand videos and 30 or 70 for the search videos.
- Engagement compares like, comment, share and save ratios against a benchmark table. It tracked comment rate most: Spearman −0.82 between our own comment-per-view ratio and the engagement score.
- Fan growth sat at 10, 45 or 55 regardless of the rest. That is why TikTok’s own account can get the “31 days” alarm and a 4.34 score at the same time.
- Racing mechanism returned “Insufficient data: No racing mechanism metrics available” in all 68 reports.
Video age matters more than likes
Simple ratios from the listing endpoints’ counts correlated weakly with fake_score: like per view −0.27, comment per view −0.41, share per view 0.16. The strongest two weren’t about engagement quality: views per follower (0.55) and video age (0.69).
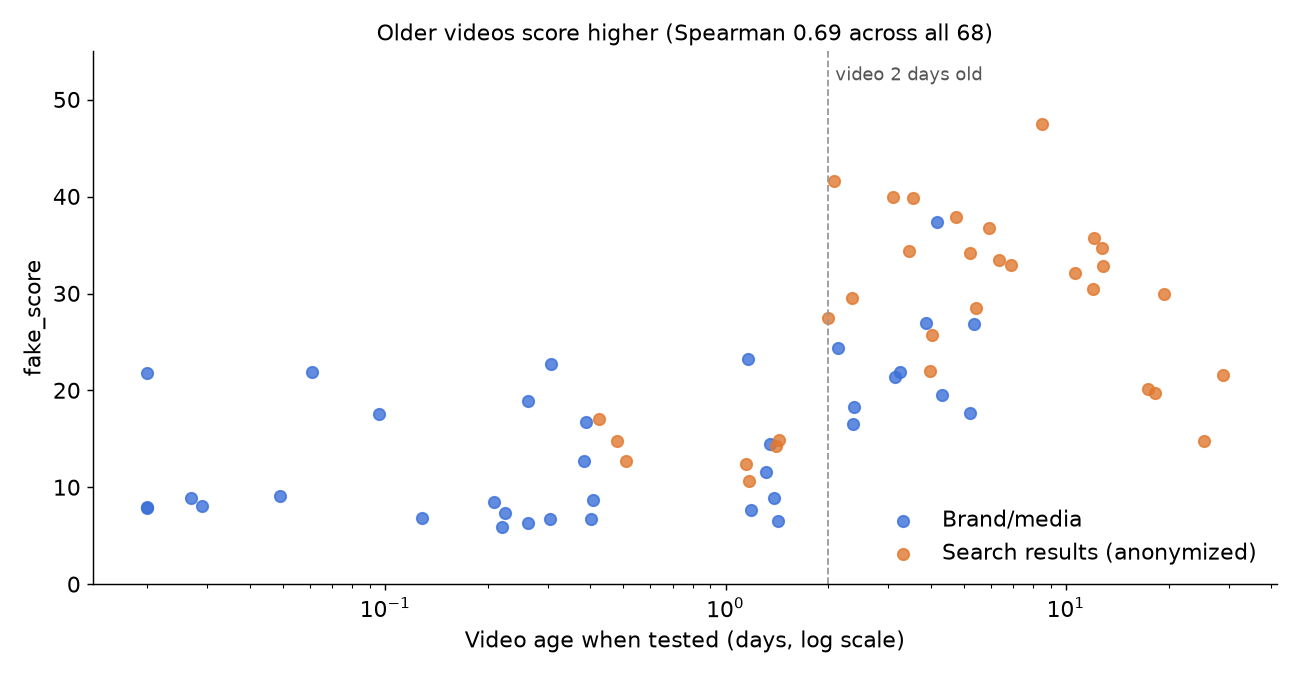
Caption: Below two days of age most videos scored under 20; above two days most scored 20 to 48, for brands and search results alike (charted from our 2026-10-04 runs).
The view-distribution block explains why. It works on a short view history whose length (stats.count) ranged from 2 to 36 points in our reports: it climbed to about 30 within a day and a half, dropped to 3 to 5 around day two (it looks like hourly points give way to daily ones), then reached 15 by three weeks. Young videos usually came back “natural”; older ones usually got an anomaly label. 18% of the 33 videos under two days old got a distribution score of 60 or more; 86% of the 35 older ones did.
That is a confound in our sample: brand videos were each account’s latest posts (median age 0.4 days); the search videos were up to 30 days old (median 5.0 days). Within the same age band the gap shrinks but doesn’t vanish:
| Age when tested | Brand median (n) | Search median (n) |
|---|---|---|
| Under 2 days | 8.8 (26) | 14.26 (7) |
| 2 days or older | 21.66 (10) | 32.86 (25) |
The remaining gap fits the verified-account terms above (creator credibility 0, a different benchmark). If you compare creators, compare videos of similar age.
Age alone isn’t the trigger: the 624-day-old TikTok video from the introduction got “Insufficient view data” and 4.34. Our inference is that the detector holds view history only for videos it tracks recently.
content_category: only for unverified creators
The endpoint takes an optional content_category (default, entertainment, education, product, verified_large) that, per its reference page, changes the engagement-rate benchmark. We ran 13 videos under all five values.
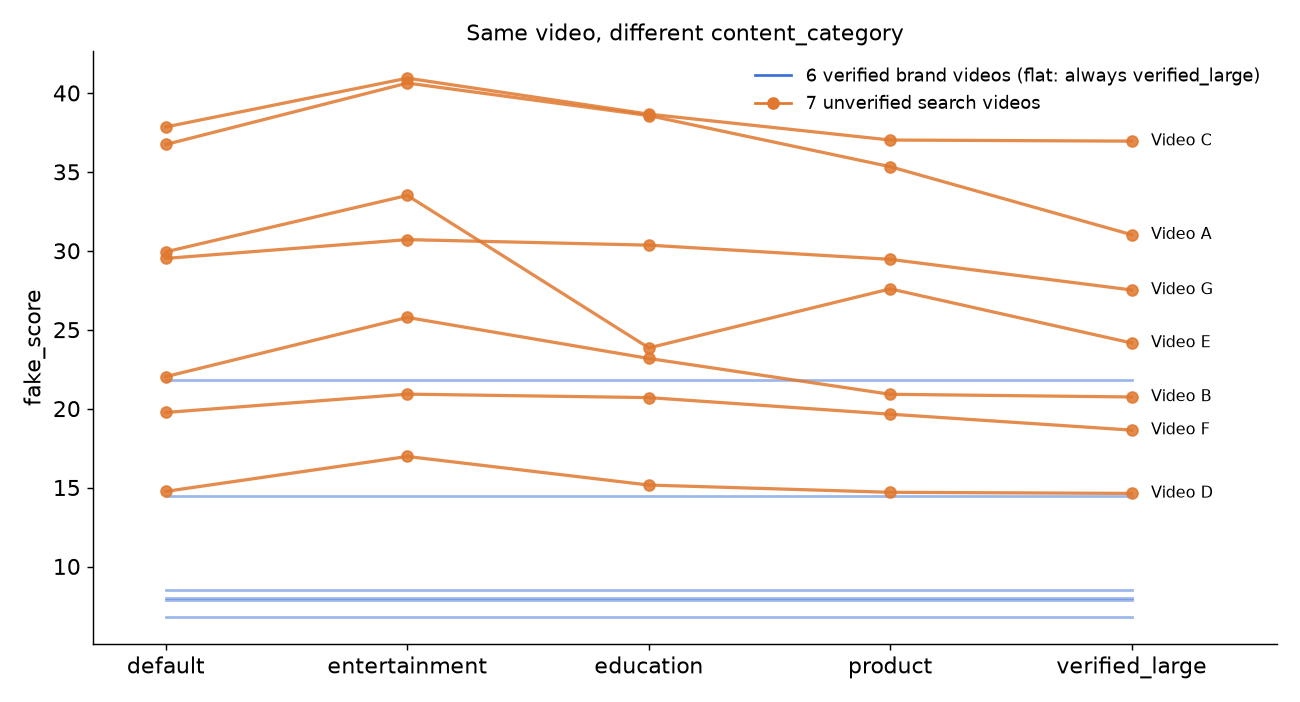
Caption: Verified brand videos scored the same under every content_category; unverified videos scored highest under entertainment and lowest under verified_large (charted from our 2026-10-04 runs).
For the six verified brand videos (TikTok, NBA, ESPN, Sephora, NFL, The Washington Post) the response reported benchmark_category: verified_large every time, whatever we sent, and each video’s score was identical under all five values. For the seven unverified videos the benchmark followed the input, and the score spread was 2.28 to 9.66 points. entertainment always gave the highest score; verified_large gave the lowest in six of seven. Five of the seven crossed a 10-point step between default and entertainment; Video A, for one, went from 36.75 (30% estimated fake) to 40.64 (40%).
Pick the category before you look at the number and keep it fixed across creators; unverified videos default to default.
Is it stable?
We re-ran 10 videos (5 brand, 5 anonymized search) at about 01:20, 01:50 and 02:15 UTC, after the 01:18 main pass. Two things showed up.
First, availability. The first repeat calls at 01:20 worked, then from 01:20:45 to 01:23:43 UTC 10 logged attempts returned HTTP 503 with “upstream error 400: Request failed. Please retry”, which also says the failed request isn’t charged. A few unlogged manual probes in the next minutes failed the same way; a call at 01:32 succeeded, and everything after that worked. Retry later, not in a tight loop.
Second, the score holds steady until the view history changes, then it jumps.
| Video (age at 01:18) | 01:18 | 01:20 | 01:50 | 02:15 | Distribution at 02:15 |
|---|---|---|---|---|---|
| @nba (1 h) | 9.14 | 9.15 | 9.12 | 21.39 | natural → statistical_anomaly |
| @espn (under 1 h) | 8.92 | 8.95 | 9.83 | 22.27 | natural → statistical_anomaly |
| @tiktok latest (32 h) | 14.47 | 14.47 | 14.96 | 25.48 | natural → statistical_anomaly |
| @duolingo (31 h) | 11.6 | failed | 11.61 | 22.76 | natural → statistical_anomaly |
| Video O, beauty (10 h) | 17.08 | 17.08 | 17.08 | 29.48 | natural → statistical_anomaly |
| 5 videos already flagged | unchanged; max spread 0.07 points |
All five “natural” videos flipped to “statistical anomaly” between 01:50 and 02:15, and their scores rose by 10.5 to 12.4 points from the 01:50 readings. For TikTok’s latest video, the view history went from 34 to 35 points in between. The five that were already flagged stayed within 0.07 points, but one of them, a food video, sat on the 40 line: 39.95, 40.01, 40.01, 39.94, so its fake_view_percentage went 30, 40, 40, 30.
One more case didn’t fit. A Red Bull video scored 8.95 at 01:18, 20.01 at 01:35, 8.73 at 01:50 and 8.72 at 02:16, with a “natural” pattern each time. The 20.01 came from a first run of the example program (it differed only in number formatting), and we didn’t keep that full response, so we can’t say which component moved.
So a report on a young video is a snapshot. Record the time, re-run after a few hours, and compare videos of similar age.
The 5% floor and the dollar figure
Three fields in the report are arithmetic, not separate measurements:
| Field | What we observed in 68 reports | How to read it |
|---|---|---|
fake_view_percentage | 5 below a score of 10, then 10 / 20 / 30 / 40 by tens, all within 0.03 of a step except 4.85 on a 371-view video | A bucket, not a measurement |
estimated_fake_views | views × percentage, within 1 view | Inherits the floor: never below 5% of views |
mcn_report.business_impact.revenue_impact | estimated fake views ÷ 1,000 × $1, stated as “average CPM of $1.00” | A fixed-rate illustration, not your contract value |
Across our 68 videos that produced 4,201,597 “estimated fake views” out of 27,859,525 views, 15%, without a single suspicious verdict. A 4.34 score on TikTok’s own video still prints 8.1 million fake views and $8,102 of “revenue impact”. The steps also make the estimate jumpy: one search video went from 39.95 to 40.01 between runs and its estimated fake views rose by a third.
Run the same check yourself
The program below screens a list of video ids and prints the fields we found worth reading, plus two ratios computed from the same response and a warning for videos under two days old. It reads only outputs[0].data and raises on anything else. The business field names (fake_view_analysis, detailed_analysis, video_metrics, view_pattern_type and so on) are ones we observed in our 2026-10-04 responses, not documented guarantees, so they’re read with .get(). The calls go to the Model API route POST /v1/api/<model> from the endpoint’s reference page.
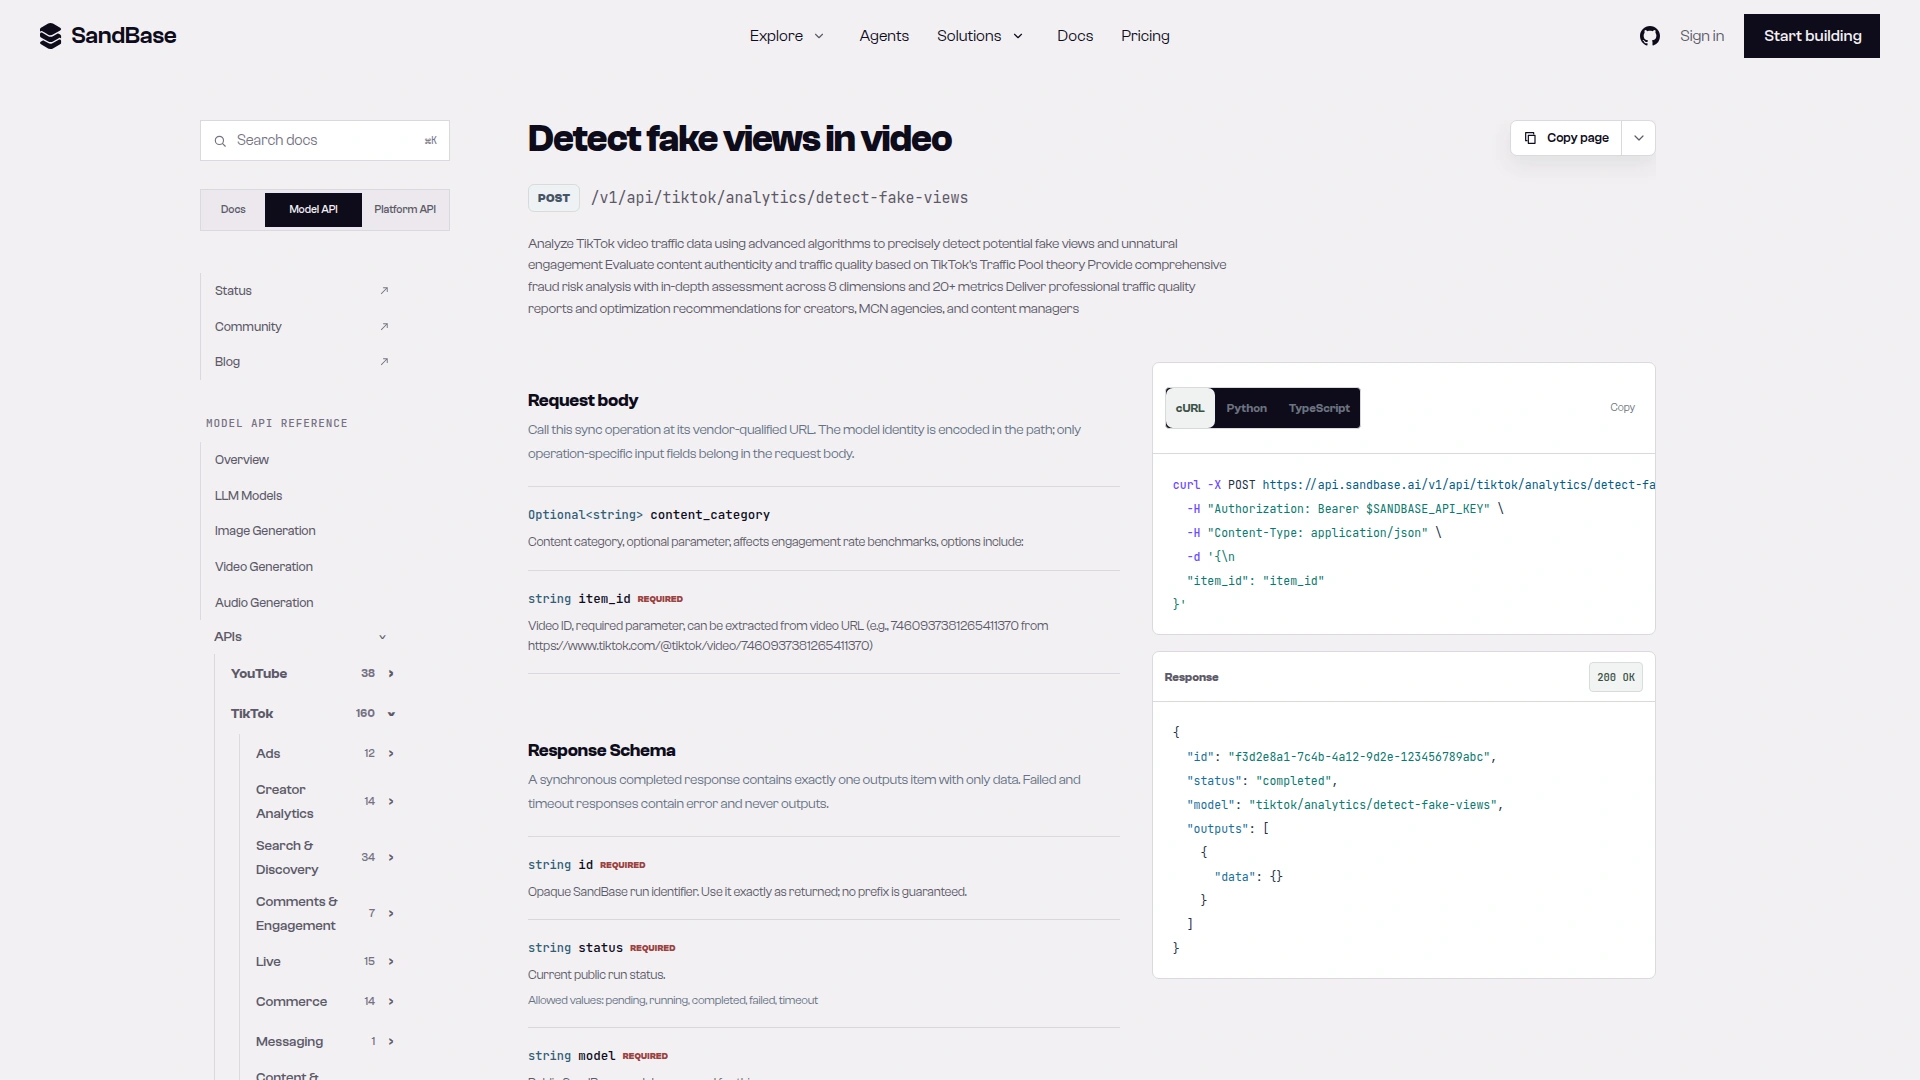
Caption: The endpoint reference documents the POST route, a required item_id and an optional content_category; its example response leaves outputs[0].data empty, so business fields are observed only (captured 2026-10-04).
import os
import sys
import time
import requests

BASE = "https://api.sandbase.ai/v1/api"
HEADERS = {"Authorization": f"Bearer {os.environ['SANDBASE_API_KEY']}"}


def call(model: str, params: dict) -> dict:
    """POST a SandBase data endpoint and return outputs[0].data, failing loudly otherwise."""
    resp = requests.post(f"{BASE}/{model}", headers=HEADERS, json=params, timeout=120)
    body = resp.json()
    outputs = body.get("outputs") or []
    if resp.status_code != 200 or body.get("status") != "completed" or not outputs:
        raise RuntimeError(f"{model} failed: HTTP {resp.status_code} {body.get('status')} {body.get('error')}")
    return outputs[0].get("data") or {}


def screen(video_id: str) -> dict:
    """Run the detector once and keep the fields our study found worth reading."""
    d = call("tiktok/analytics/detect-fake-views", {"item_id": video_id})
    fa = d.get("fake_view_analysis") or {}
    da = d.get("detailed_analysis") or {}
    vm = d.get("video_metrics") or {}
    views = vm.get("total_views") or 0
    age_days = (time.time() - (d.get("content_metrics") or {}).get("creation_time", time.time())) / 86400
    thin = [name for name, block in da.items()
            if isinstance(block, dict) and any("nsufficient" in str(i) for i in block.get("issues") or [])]
    return {
        "video": video_id,
        "views": views,
        "age_d": round(age_days, 1),
        "score": fa.get("fake_score"),
        "pct": fa.get("fake_view_percentage"),
        "suspicious": fa.get("is_suspicious"),
        "confidence": fa.get("confidence_level"),
        "benchmark": (da.get("engagement") or {}).get("benchmark_category"),
        "pattern": d.get("view_pattern_type"),
        # our own ratios from the same response, so you can check them against your benchmarks
        "like/view": f"{(vm.get('total_likes') or 0) / views:.4f}" if views else None,
        "comment/view": f"{(vm.get('total_comments') or 0) / views:.5f}" if views else None,
        "thin_data": ",".join(thin) or "-",
    }


if __name__ == "__main__":
    cols = ["video", "views", "age_d", "score", "pct", "suspicious", "confidence",
            "benchmark", "pattern", "like/view", "comment/view", "thin_data"]
    print("\t".join(cols))
    for vid in sys.argv[1:]:
        try:
            row = screen(vid)
        except (RuntimeError, ValueError, requests.RequestException) as err:
            print(f"{vid}\terror: {err}")  # upstream 503s happen; retry later rather than in a tight loop
            continue
        print("\t".join(str(row[c]) for c in cols))
        if row["age_d"] < 2:
            print(f"{vid}\tnote: under 2 days old; distribution checks have little history yet")
Tested on 2026-10-04 (UTC). Input: TikTok’s own public video 7460937381265411370, the id in the endpoint’s schema example. Request at 01:32 UTC:
curl -X POST https://api.sandbase.ai/v1/api/tiktok/analytics/detect-fake-views \
  -H "Authorization: Bearer $SANDBASE_API_KEY" \
  -H "Content-Type: application/json" \
  -d '{"item_id": "7460937381265411370"}'
Trimmed response from that run:
{
 "id": "621146a2-cf67-4dcf-a9e8-a15a63830cea",
 "status": "completed",
 "model": "tiktok/analytics/detect-fake-views",
 "outputs": [
  {
   "data": {
    "fake_view_analysis": {
     "component_scores": {
      "consistency_score": 0,
      "content_authenticity_score": 34.0,
      "creator_credibility_score": 0,
      "distribution_score": 0,
      "engagement_score": 0.0,
      "fan_growth_score": 45,
      "follower_correlation_score": 35.0,
      "racing_mechanism_score": 0
     },
     "confidence_level": "Minimal",
     "estimated_fake_views": 8102335,
     "fake_score": 4.34,
     "fake_view_percentage": 5.0,
     "is_suspicious": false,
     "main_detection_reason": "Multiple Anomalous Indicators"
    },
    "video_metrics": {
     "total_views": 162046716,
     "total_likes": 15925353,
     "total_comments": 359944,
     "total_shares": 1318334
    }
   }
  }
 ]
}
Inside outputs[0].data only fake_view_analysis (complete) and four video_metrics keys are kept; detailed_analysis, creator_metrics, content_metrics, mcn_report, traffic_pool and the other blocks are omitted. The envelope (id, status, model, outputs[0].data) is documented; everything inside data is observed, not documented. A run on the same video about 20 minutes earlier returned the same 4.34.
We then ran the program above verbatim at 02:16 UTC, with SANDBASE_API_KEY set in the environment, on that video, one Nike video and one Red Bull video (brand accounts only). It printed:
video	views	age_d	score	pct	suspicious	confidence	benchmark	pattern	like/view	comment/view	thin_data
7460937381265411370	162046776	624.4	4.34	5.0	False	Minimal	verified_large	insufficient_data	0.0983	0.00222	consistency,distribution,racing_mechanism
7691063003759922445	179037	4.2	37.47	30.0	False	Minimal	verified_large	low_entropy	0.0046	0.00008	racing_mechanism
7692048484546907414	7497651	1.4	8.72	5.0	False	Minimal	verified_large	natural	0.0667	0.00035	racing_mechanism
7692048484546907414	note: under 2 days old; distribution checks have little history yet
The Red Bull video is the one from the stability section: 8.72 here, 41 minutes after the 20.01 we saw at 01:35.
To adapt it, the request fields are in the detect-fake-views API reference, and the sample-building endpoints are in the video search reference. Get a SandBase API key to run it on the videos you are evaluating.
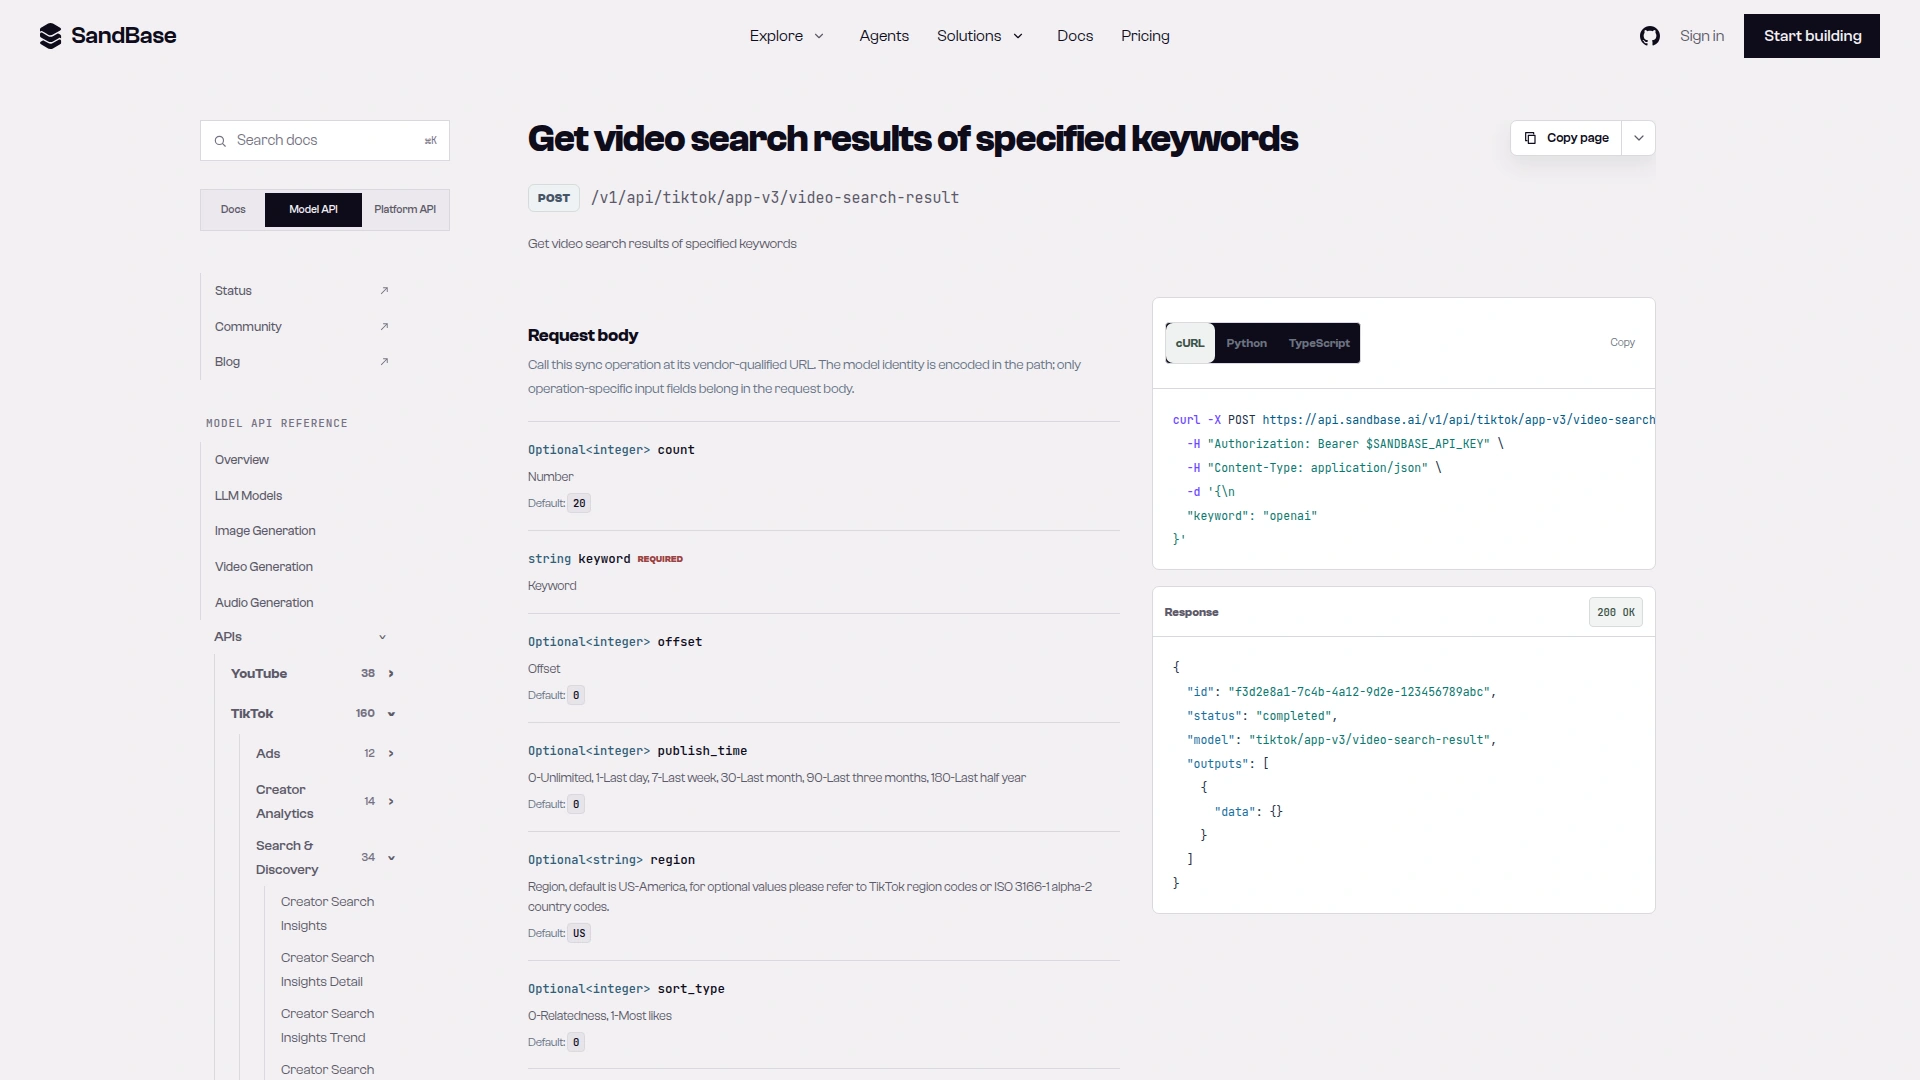
Caption: The video search reference we used to build the anonymized sample, with keyword, publish_time and region parameters (captured 2026-10-04).
Scope of the data: these are public, read-only lookups that need a SandBase API key. SandBase isn’t an official TikTok partner, and nothing here touches private accounts, DMs, a creator’s own analytics or account actions. A creator’s TikTok Studio data or TikTok Creator Marketplace reports are first-party sources; this detector isn’t.
How to use the report
| You see | What it likely means | What to do |
|---|---|---|
is_suspicious: false, score under 10 | No check fired strongly | Screen passed; don’t quote the 5% estimate as fact |
| Score 20 to 40 on a video older than 2 days | Often the distribution check, which flags most older videos | Compare with similar-age videos from other creators |
| ”Critical: Comment Ratio is extremely low” | Below the benchmark table for that category | Check comments yourself; a low comment rate has many causes |
| Follower-growth alarms on a big account | Often old history | Ignore on its own; it barely moves the score |
| Any number you plan to put in a negotiation | A heuristic | Ask the creator for first-party analytics screenshots |
For pulling a creator’s recent posts and profile first, our TikTok creator research API tutorial covers the endpoints, and the TikTok data API overview lists the rest. The Douyin KOL evaluation guide shows the same vetting problem with first-party platform data.
Related
If you just want to check one video, the step-by-step guide is how to check fake views on a TikTok video. To run the same detector over a creator’s recent posts and get a short vetting memo, see the TikTok creator audit agent.
FAQ
Can a tool detect fake TikTok views?
It can estimate risk signals from public numbers, but it can’t see who watched. In our test it flagged no video as suspicious, and we had no ground truth to check it against.
What are the signs of fake TikTok views?
The detector checks like, comment, share and save rates against a benchmark table, and the shape of view growth. In our data, very low comment-per-view was the engagement ratio its score followed most. Each signal has innocent causes, such as a video that mostly gets shared by DM.
What is a normal TikTok engagement rate?
This endpoint’s own tier_benchmarks for like_follower_ratio average 0.002 for its largest tier and 0.03 for micro accounts. Our brand sample’s median like-per-view was 0.064 and the search sample’s 0.071. These are one vendor’s tables and one small sample, not platform norms.
Why does a clean video still show estimated fake views?
Because fake_view_percentage never went below about 5 in our 68 reports (lowest 4.85, on a 371-view video), and estimated_fake_views is views times that percentage. TikTok’s 162M-view video got 8.1M “fake views” with a 4.34 score.
Does content_category change the result?
For verified accounts we tested, no: the benchmark stayed verified_large. For unverified creators it moved the score by up to 9.7 points, highest under entertainment.
Limitations
68 videos, one day, US search results, one detector. No labeled fake-view data, so no accuracy claim. The brand and search groups differ in age, verification and size at once; we controlled only for age, and only roughly. The repeat test covers ten videos over about an hour. The weights above come from our linear fit, not from the vendor. We never saw a suspicious verdict, so we can’t say where that threshold is or how it behaves. Raw responses stay internal because the search group contains third-party creators’ data; the method, aggregates and brand-video examples are all here.