MiniMax M3.1 Flash vs GLM, DeepSeek, Gemini, Claude: City Script Test
MiniMax M3.1 Flash vs GLM-5.3-Flash, DeepSeek V4.1 Flash, Gemini 3.8 Flash and Claude Sonnet 5.5 in 72 live city-script requests: valid JSON, wall outlines, coordinates, cost.

At default effort, MiniMax M3.1 Flash spent all 16,000 of its completion tokens on reasoning in 7 of 9 requests and returned no JSON. The task was one era of a city film script. At reasoning_effort: "low" the same model returned valid JSON 9 times out of 9, in a median of 25.6 seconds, for $0.0154 across all nine calls.
That gap is the first thing to know if you use M3.1 Flash as the director model for AI City Remix, SandBase’s city-story video challenge. It is not the only thing. We ran the same era-writing task through GLM-5.3-Flash, DeepSeek V4.1 Flash, Gemini 3.8 Flash and Claude Sonnet 5.5 on October 23, 2026, and scored every answer with the Skill’s own validator and Wikidata coordinates. This article is for developers choosing a model to write structured, geographic, fact-heavy JSON. The contest requires M3.1 Flash as director, so for entrants the useful question is what to check after it writes.
MiniMax M3.1 Flash vs other models: Key takeaway
- M3.1 Flash at low effort, and Gemini 3.8 Flash and Claude Sonnet 5.5 at their defaults, returned a usable era in 9 of 9 requests. GLM-5.3-Flash at low managed 7 of 9; DeepSeek V4.1 Flash managed 5 of 9 even at low.
- Default effort was the main failure. DeepSeek, GLM and M3.1 Flash hit the 16,000-token cap with empty content in 4–7 of 9 requests each.
- Every model placed famous landmarks well: median errors were 12–34 meters against Wikidata in every config with more than one usable answer.
- Wall outlines separated the models. Gemini’s and Claude’s polygons contained 29 of 30 requested landmarks combined. M3.1 Flash’s contained 5 of 15, and its Paris wall came out at 0.11–0.62× the documented 253 hectares.
- Among configs with at least five usable eras, cost per usable era ranged from about $0.0009 (GLM low) and $0.0017 (M3.1 Flash low) to $0.025 (Gemini) and $0.055 (Claude), on SandBase list prices.
Why test a city script
The city-through-time Skill turns one story.json into a narrated map film. The model writes only text: year, label, narration, colour, an OpenStreetMap reference for each wall, a fallback polygon, and up to two landmarks with coordinates. The Skill’s instructions tell the agent to use M3.1 Flash through SandBase and to send one era per request at low effort.
This is a harder test than it looks. One answer has to be valid JSON in a specific schema, historically correct, and geographically plausible at two scales: a point for a cathedral, and a 20-point ring for a medieval wall. Each of those can fail on its own, and the Skill’s documentation warns that misattributed walls and fallback outlines several kilometres off are common.
We used three walls with well-documented facts:
| City | Era requested | Required landmarks | Reference facts |
|---|---|---|---|
| Paris | Wall of Philip II Augustus | Notre-Dame de Paris, the Louvre fortress | Fortified 1190–1213; enclosed 253 ha (Wikipedia) |
| Rome | Aurelian Walls | Colosseum, Pantheon | Built AD 271–275 under Aurelian; 13.7 km² (Wikipedia) |
| Istanbul | Theodosian Walls | Hagia Sophia, Hippodrome | Theodosius II; first phase under Anthemius, finished 413 (Wikipedia) |
Every request used the same system prompt (the Skill’s full references/story.md) and the same user prompt asking for one era object with an OSM reference, a 12–30 point fallback polygon and exactly those two events. We set max_tokens to 16,000 and called each model through SandBase’s OpenAI-compatible Chat Completions endpoint with streaming. A first non-streaming pass lost several long calls to dropped connections, so we discarded it and reran every config streamed.
The models and their prices
All five models are on SandBase’s LLM price comparison page. Prices below are SandBase list prices per million tokens, checked on October 23.
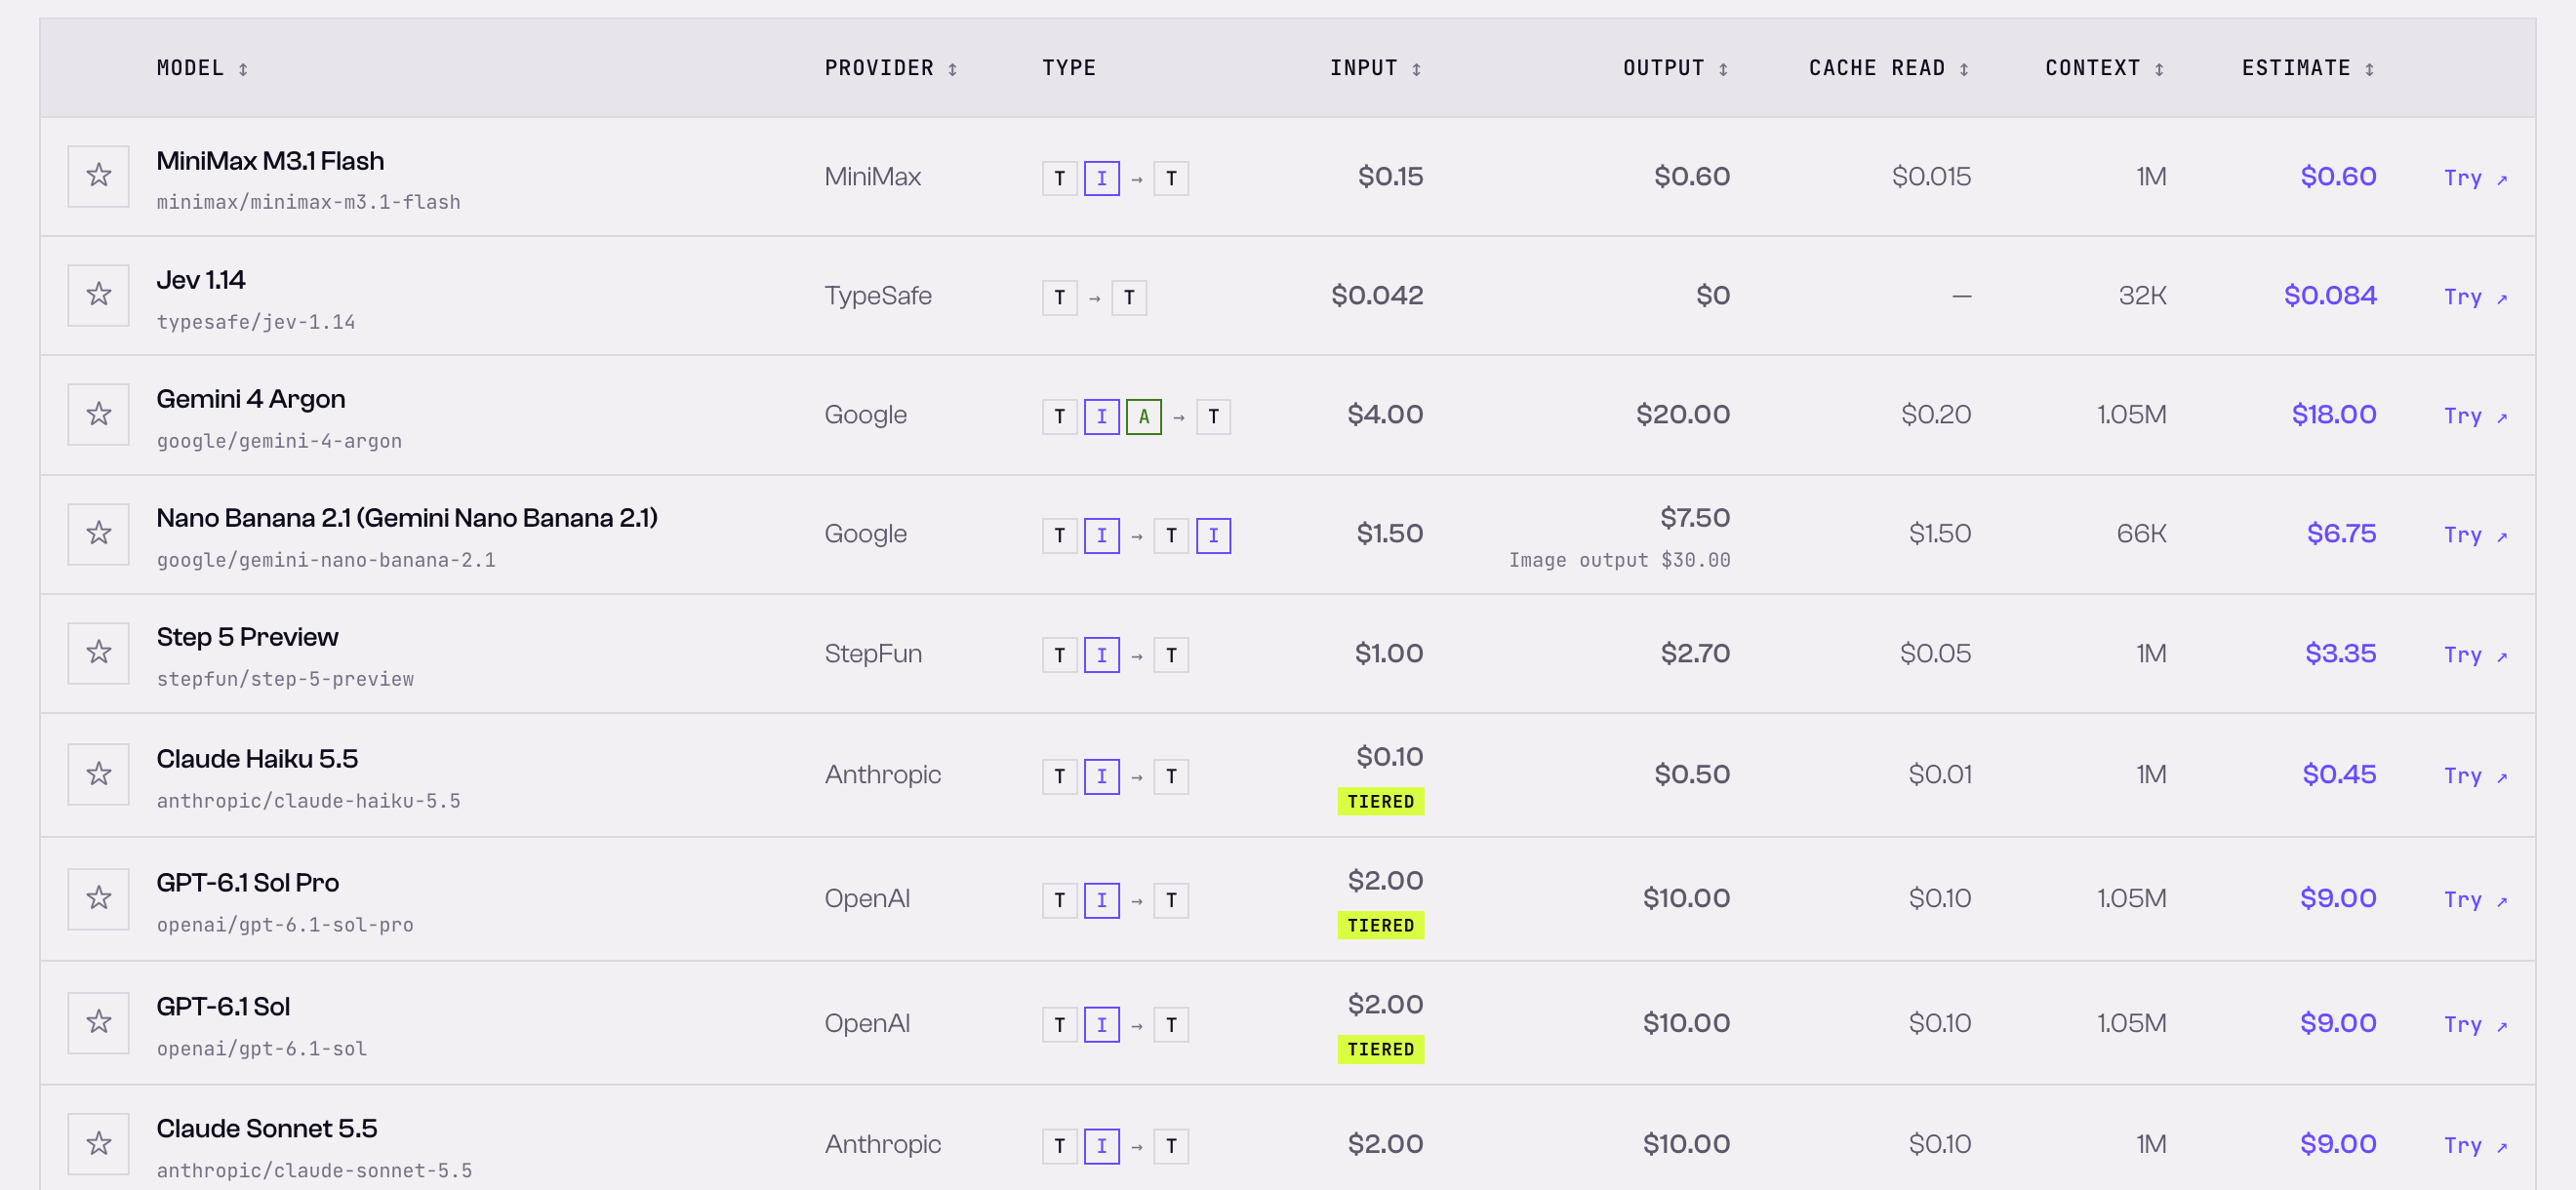 SandBase LLM price comparison, captured 2026-10-23 (default sort). M3.1 Flash and Claude Sonnet 5.5 are visible here; the other three rows are on the same page.
| Model (SandBase ID) | Input / 1M | Output / 1M | Configs we ran |
|---|---|---|---|
MiniMax M3.1 Flash (minimax/minimax-m3.1-flash) | $0.15 | $0.60 | low, default |
GLM-5.3-Flash (z-ai/glm-5.3-flash) | $0.15 | $0.50 | low, default |
DeepSeek V4.1 Flash (deepseek/deepseek-v4.1-flash) | $0.30 | $1.20 | low, default |
Gemini 3.8 Flash (google/gemini-3.8-flash) | $1.50 | $7.50 | default |
Claude Sonnet 5.5 (anthropic/claude-sonnet-5.5) | $2.00 | $10.00 | default |
We first ran DeepSeek and GLM at their defaults only. Both ran out of tokens the same way M3.1 Flash did, so we added a low-effort pass for each. Holding them to defaults while M3.1 Flash got the lever the Skill recommends would not have been a fair comparison. Gemini and Claude ran with no effort field, and neither came near the cap.
Results: valid JSON, outlines and cost
Each config got 9 requests (3 cities × 3 runs). “Usable era” means the Skill’s own validateStory() accepted the object, so resolve.mjs would have taken it. That makes it a format gate, not a quality score.
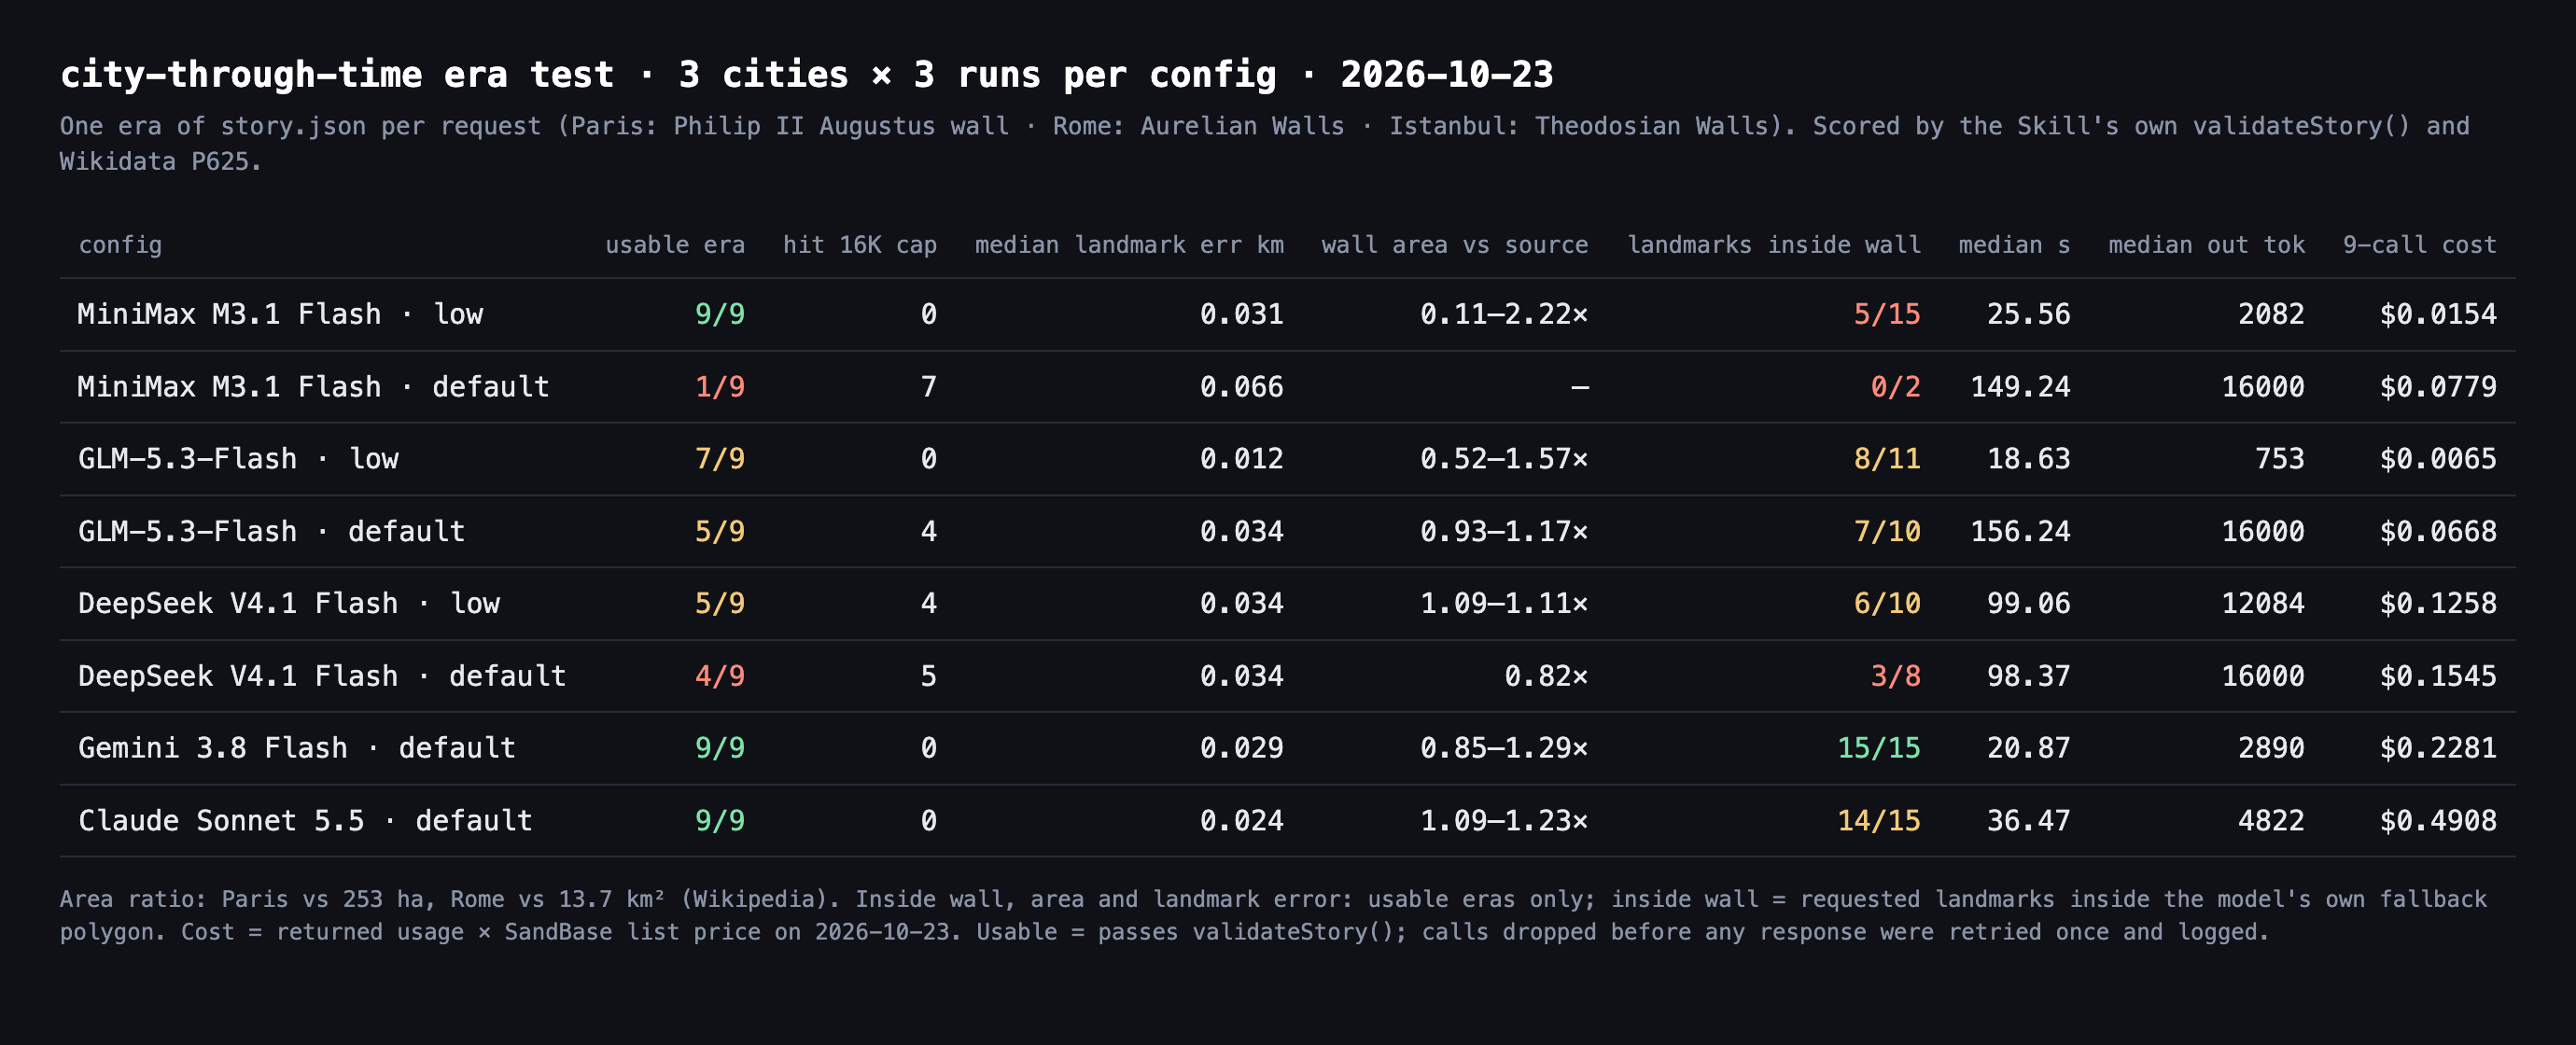 Our scoreboard from
summary.json, 2026-10-23: 72 request slots across eight configs; two connection drops before any response were retried once and logged.
| Config | Usable era | Hit 16K cap | Landmarks inside wall | Wall area vs source | Median latency | 9-call cost |
|---|---|---|---|---|---|---|
| M3.1 Flash · low | 9/9 | 0 | 5/15 | 0.11–2.22× | 25.6 s | $0.0154 |
| M3.1 Flash · default | 1/9 | 7 | 0/2 | – | 149.2 s | $0.0779 |
| GLM-5.3-Flash · low | 7/9 | 0 | 8/11 | 0.52–1.57× | 18.6 s | $0.0065 |
| GLM-5.3-Flash · default | 5/9 | 4 | 7/10 | 0.93–1.17× | 156.2 s | $0.0668 |
| DeepSeek V4.1 Flash · low | 5/9 | 4 | 6/10 | 1.09–1.11× | 99.1 s | $0.1258 |
| DeepSeek V4.1 Flash · default | 4/9 | 5 | 3/8 | 0.82× | 98.4 s | $0.1545 |
| Gemini 3.8 Flash · default | 9/9 | 0 | 15/15 | 0.85–1.29× | 20.9 s | $0.2281 |
| Claude Sonnet 5.5 · default | 9/9 | 0 | 14/15 | 1.09–1.23× | 36.5 s | $0.4908 |
“Landmarks inside wall” counts the requested landmarks that fall inside the model’s own fallback polygon (Notre-Dame for Paris; both landmarks for Rome and Istanbul). Like the landmark and area figures, it counts usable eras only, so the denominator shrinks when a config produced fewer of them. “Wall area” covers Paris and Rome only; we found no single documented area for Istanbul’s walled city.
Finding 1: effort settings decided more than the model did
The biggest effect in the table is not a model at all. It is the effort setting.
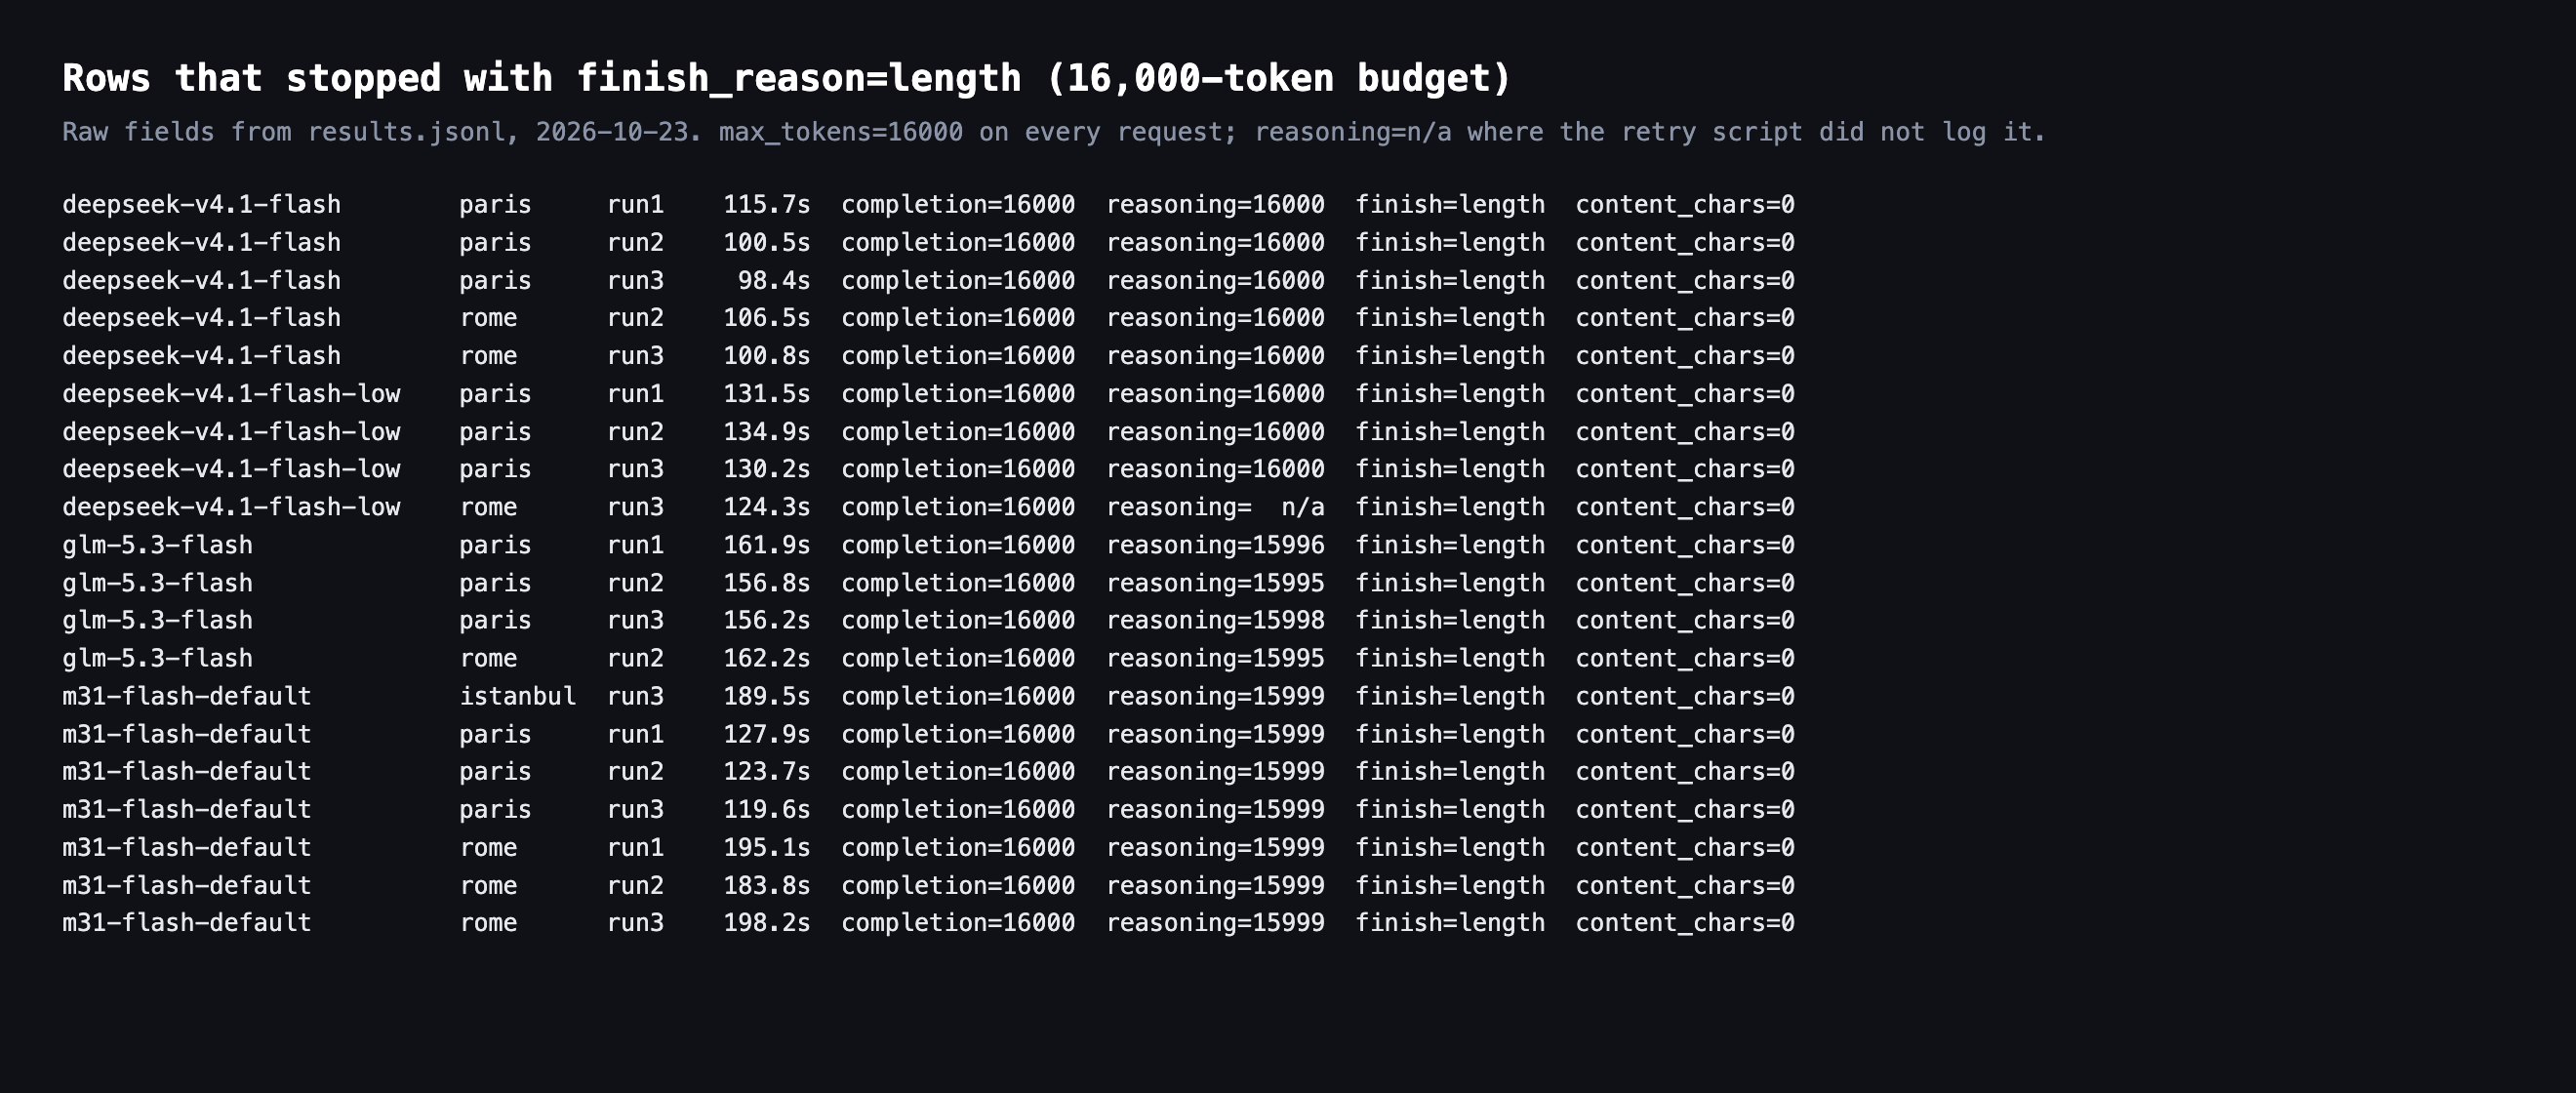 Every row that ended with
finish_reason: length, from results.jsonl: almost all 16,000 tokens went to reasoning and no answer text came back. Reasoning shows n/a for one retried row whose retry did not log it.
Three things stand out in the raw rows:
- M3.1 Flash at default never got to the answer. Seven requests ended at 15,999 reasoning tokens and zero content characters, after 120–198 seconds. One more stream closed after 60 seconds with no content and no usage. MiniMax documents
maxas the default when effort is omitted, and on this task max meant the whole budget went to thinking. - Low effort removed the token-cap failures for M3.1 Flash and GLM. M3.1 Flash at low used a median of 2,082 completion tokens; GLM at low used 753. Neither hit the cap once.
- DeepSeek V4.1 Flash still ran out at low. All three Paris requests at low ended at 16,000 reasoning tokens after about 130 seconds, as did one Rome request. Lowering effort helped Istanbul (3 of 3 usable) but not Paris.
There is also an operational reason to care. The Skill notes that sync requests running past about two minutes are dropped by the SandBase CLI. Fourteen of the twenty cap hits in our logs ran longer than that, so through the CLI they would have shown up as timeouts rather than empty answers. If you see one, check effort before you blame the model.
GLM’s default runs had one oddity. Two Istanbul requests returned more than 16,000 completion tokens (17,073 and 21,033) and still finished with an answer. We report these as observed; we did not find out why the cap did not apply.
Finding 2: points are easy, outlines are hard
Coordinates for famous landmarks were not the problem. Median landmark errors against Wikidata were 12–34 meters in every config except M3.1 Flash at default, which had only one usable answer. Every usable Paris answer put Notre-Dame within 8 meters of its Wikidata position. The largest single error was M3.1 Flash placing Hagia Sophia 1.14 km off in one Istanbul run.
The fallback polygon is where models diverged. It is also the part a viewer sees: when OSM has nothing under the model’s wall name, the film lights up the model’s own polygon and prints its area on screen.
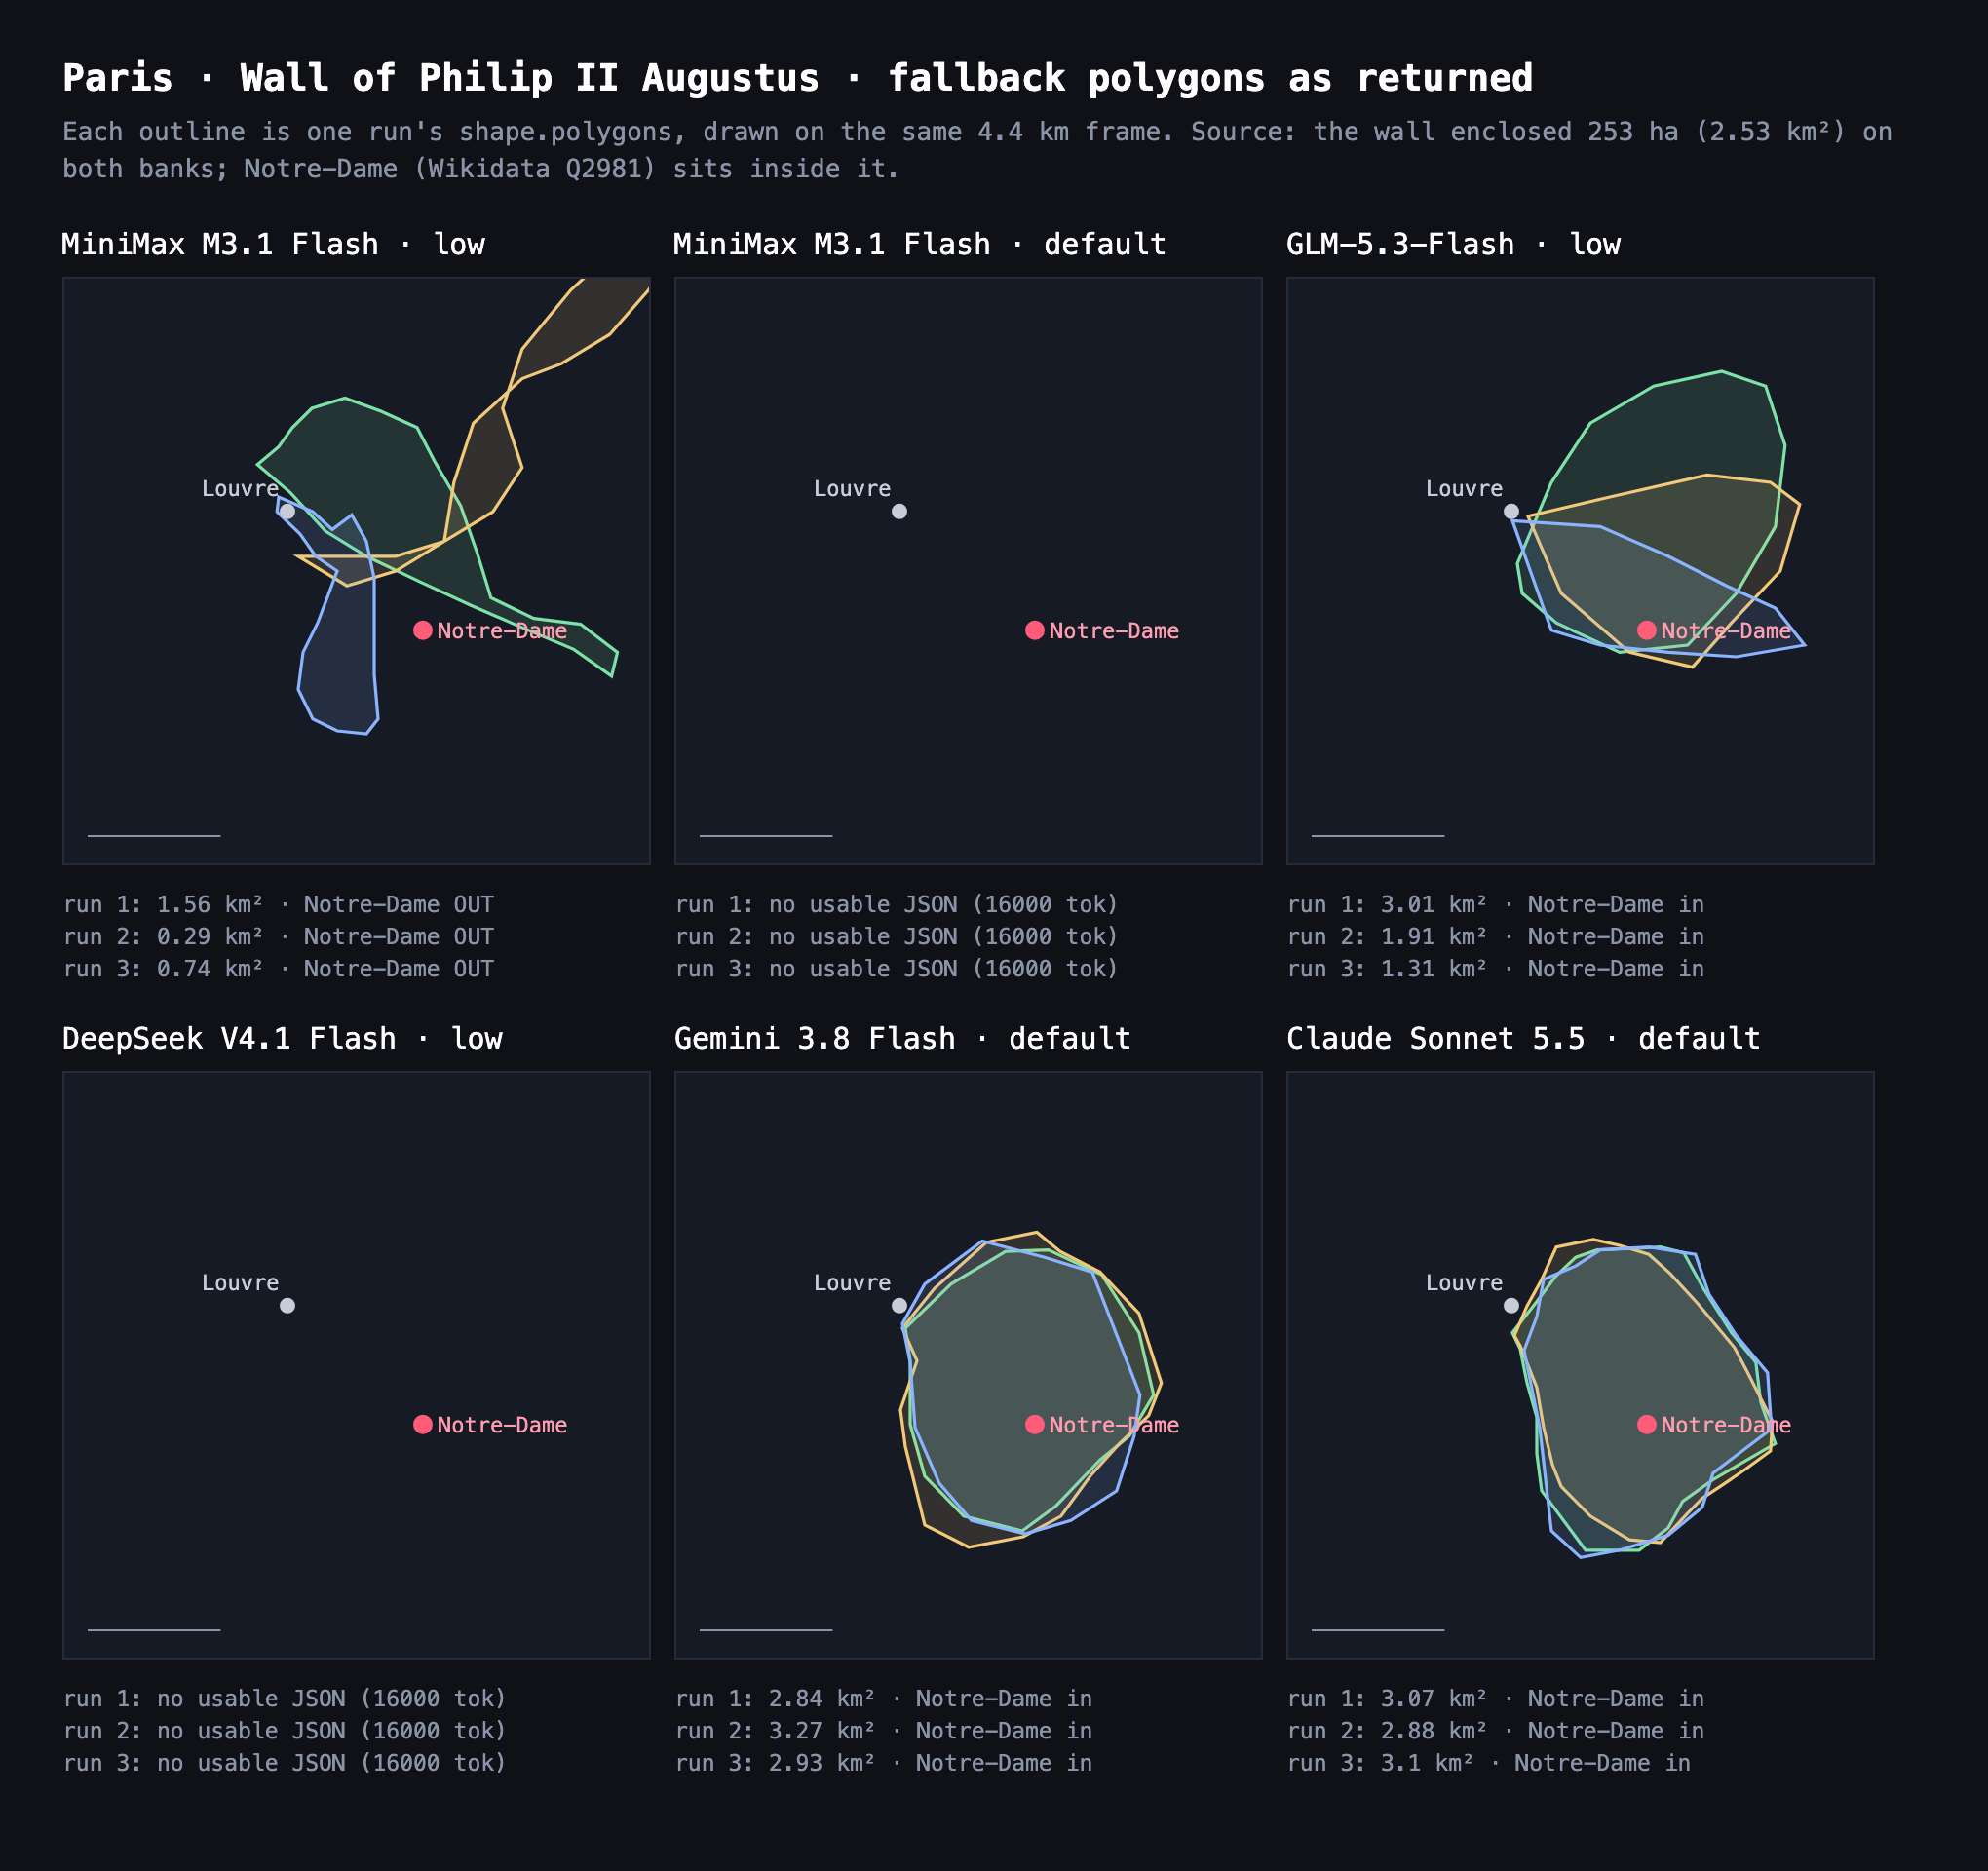 Every Paris polygon each config returned, drawn on the same 4.4 km frame. Gemini 3.8 Flash and Claude Sonnet 5.5 drew consistent rings of 2.8–3.3 km² around Notre-Dame; M3.1 Flash at low drew three different shapes, none containing it.
The panels make the pattern clear:
- M3.1 Flash at low returned valid JSON every time, but its Paris rings covered 0.29–1.56 km² against a documented 2.53 km². None of the three contained Notre-Dame, which sits on the Île de la Cité, well inside the real wall. In Rome one ring came out at 2.22× the real area. In Istanbul none of its three rings contained Hagia Sophia.
- GLM-5.3-Flash at low contained Notre-Dame every time, but its shapes varied from run to run (1.31–3.01 km²).
- Gemini 3.8 Flash and Claude Sonnet 5.5 were consistent across runs and close in size: 0.85–1.29× and 1.09–1.23× the documented areas. Both slightly overshoot in Paris, which is expected when you trace a wall along modern streets.
Dates and names were mostly right everywhere. Every usable answer named the right builder. The one year miss was M3.1 Flash dating the Theodosian Walls to “c. AD 440” in one run, against completion in 413. Its other two runs labelled them “408–439”, a range we would not put on screen without a source.
Scope of this finding: three walls, three runs each, one day. A wall the models know less well, in a city with sparse OSM coverage, could change the ranking.
Finding 3: cost per usable era
Raw cost per call misleads when failures burn the most tokens. Dividing each config’s total by its usable eras gives a fairer number:
| Config | Cost per usable era | Notes |
|---|---|---|
| GLM-5.3-Flash · low | ≈ $0.0009 | Cheapest; 2 of 9 failed the validator (a stat over 60 characters, a narration over 300) |
| MiniMax M3.1 Flash · low | ≈ $0.0017 | Every answer valid and bare JSON; outlines unreliable |
| DeepSeek V4.1 Flash · low | ≈ $0.025 | Long reasoning even at low |
| Gemini 3.8 Flash · default | ≈ $0.025 | Best outlines in this test, at 15× M3.1 Flash low |
| Claude Sonnet 5.5 · default | ≈ $0.055 | Similar quality to Gemini, about 2× its cost and slower |
| DeepSeek V4.1 Flash · default | ≈ $0.039 | Four usable eras in nine |
| MiniMax M3.1 Flash · default | ≈ $0.078 | One usable era in nine |
For context, a full eight-era city story is nine requests. At M3.1 Flash low rates that is about $0.015, while the narration and illustrations for our Vienna story were estimated at about $0.69. Even Claude’s script would come to roughly $0.50, which is still less than the media. For a single film, script cost is not the deciding factor; outline quality and failure rate are.
How to choose, and what entrants should do
| If you need… | Choose | Why |
|---|---|---|
| An AI City Remix entry | MiniMax M3.1 Flash at reasoning_effort: "low" | The rules require it as director; it was 9/9 valid at low |
| The cheapest valid JSON at scale | GLM-5.3-Flash at low, or M3.1 Flash at low | Both are under $0.002 per era; add a schema-repair step for GLM |
| Outlines you can show without redrawing | Gemini 3.8 Flash or Claude Sonnet 5.5 | Consistent, right-sized rings in all 12 of their Paris and Rome runs |
| A model that tolerates long reasoning | Any, with effort set explicitly | Defaults burned the whole budget for three of five models |
If you are entering AI City Remix, keep M3.1 Flash as the director and stop trusting its fallback polygons. Treat the polygon as a placeholder. Make the OSM reference do the work: use the wall’s real name in OSM, or a regex of the boulevards that follow its line. Then confirm in resolve.mjs output that the outline came from OSM and not from the fallback. For landmarks, M3.1 Flash’s coordinates were fine for famous sites, but replacing them with Wikidata values takes one request each and removes the risk. That automated check is also the kind of workflow the 30% AI-workflow criterion rewards.
Two things this test does not show. It does not compare narration quality or storytelling, which the judges weigh at 25%. It also says nothing about long-horizon agent work or coding, where vendor benchmarks put these models in a different order; see our M3.1 Flash pricing and benchmark guide and M3.1 Flash vs DeepSeek V4.1 Flash for those.
FAQ
Which model writes the most accurate city-through-time script?
In our 72 request slots on October 23, 2026, Gemini 3.8 Flash and Claude Sonnet 5.5 produced the most accurate wall outlines and were valid in 9 of 9 requests. MiniMax M3.1 Flash at low effort was equally valid and 15–32× cheaper, but its fallback outlines were often the wrong size or shape.
Why did MiniMax M3.1 Flash return empty answers?
At default effort, which MiniMax documents as max, it spent all 16,000 completion tokens on reasoning in 7 of 9 requests and stopped with finish_reason: length before writing any content. Setting reasoning_effort: "low" fixed it in all 9 requests.
Can I use Gemini or Claude for an AI City Remix entry?
Not as the director. The rules require MiniMax M3.1 Flash to direct the entry through SandBase, and you declare that when uploading. The FAQ allows any tool chain around it (the Skills themselves call speech and image models), but writing the script with another LLM would replace the director. For better geometry, pull outlines and coordinates from OpenStreetMap and Wikidata.
How much does the script cost compared with the film?
For an eight-era story, M3.1 Flash at low cost about $0.0017 per usable era in our test, or roughly $0.015 per script. The Skill’s estimate for the narration and illustrations of our Vienna story was $0.69.
Is this a general benchmark of these models?
No. It is one structured, geographic task with three cities and three runs per config on one day, scored programmatically. It shows behaviour on this kind of JSON-writing work, not overall model quality.
For the contest, the choice is already made, and the test shows how to use it well. Run MiniMax M3.1 Flash at low effort, which made it reliable and nearly free here. Get your outlines and coordinates from data rather than from the model’s memory, because that is where it was weakest. Outside the contest, Gemini 3.8 Flash was the best value for geography that has to look right on the first render.